About this publication
Publication details
The key national trends
- Australia’s teacher workforce is experienced, but there was an increase in the proportion of the teacher workforce who were relatively newer to the profession from 2021 to 2022.
- The proportion of early career teachers returned closer to pre-pandemic levels in 2022, following a sharp decline during COVID-19 in 2020.
- The teacher workforce was less likely to be employed under an ongoing employment arrangement in 2022.
- Men are over-represented among school leaders.
- Leaders have undertaken more diverse tasks recently, with senior leaders interacting with parents more, and spending more time on professional learning for staff, than middle leaders.
- The critical window for transitioning into middle leadership is at 10-19 years of experience, followed closely by 20-29 years of experience.
- Casual employment among early career teachers slightly decreased from 2020 to 2022, but rates of long-fixed term contracts (> 1 year) and permanent/ongoing employment have increased.
- Between 2020 and 2022, the proportion of all early career teachers who reported receiving a formal induction decreased, with a larger decrease for those with less experience.
- In 2022, the most remote and very remote teachers were more likely to be employed full-time than their counterparts in other areas.
- ‘Workload and coping’ remains the top category of reasons for leaving for those in the regional and remote teacher workforce as well as teachers in major cities.
- In 2020, intentions to leave the profession prior to retirement decreased to the lowest recorded level (22%), however in 2022, with these disruptions largely finished, intentions to leave increased to their highest recorded level (34%).
- After age 30, the intentions of teachers to leave the profession before retirement get lower as they approach retirement age.
- For each year since ITE graduation, the proportion of the cohort who has discontinued registration increases by 1.3 percentage points.
- Intentions to leave the profession within 1 year are generally aligned with annual registration discontinuation rates.
Learn more about the Australian Teacher Workforce Data Initiative
All Registered Teachers
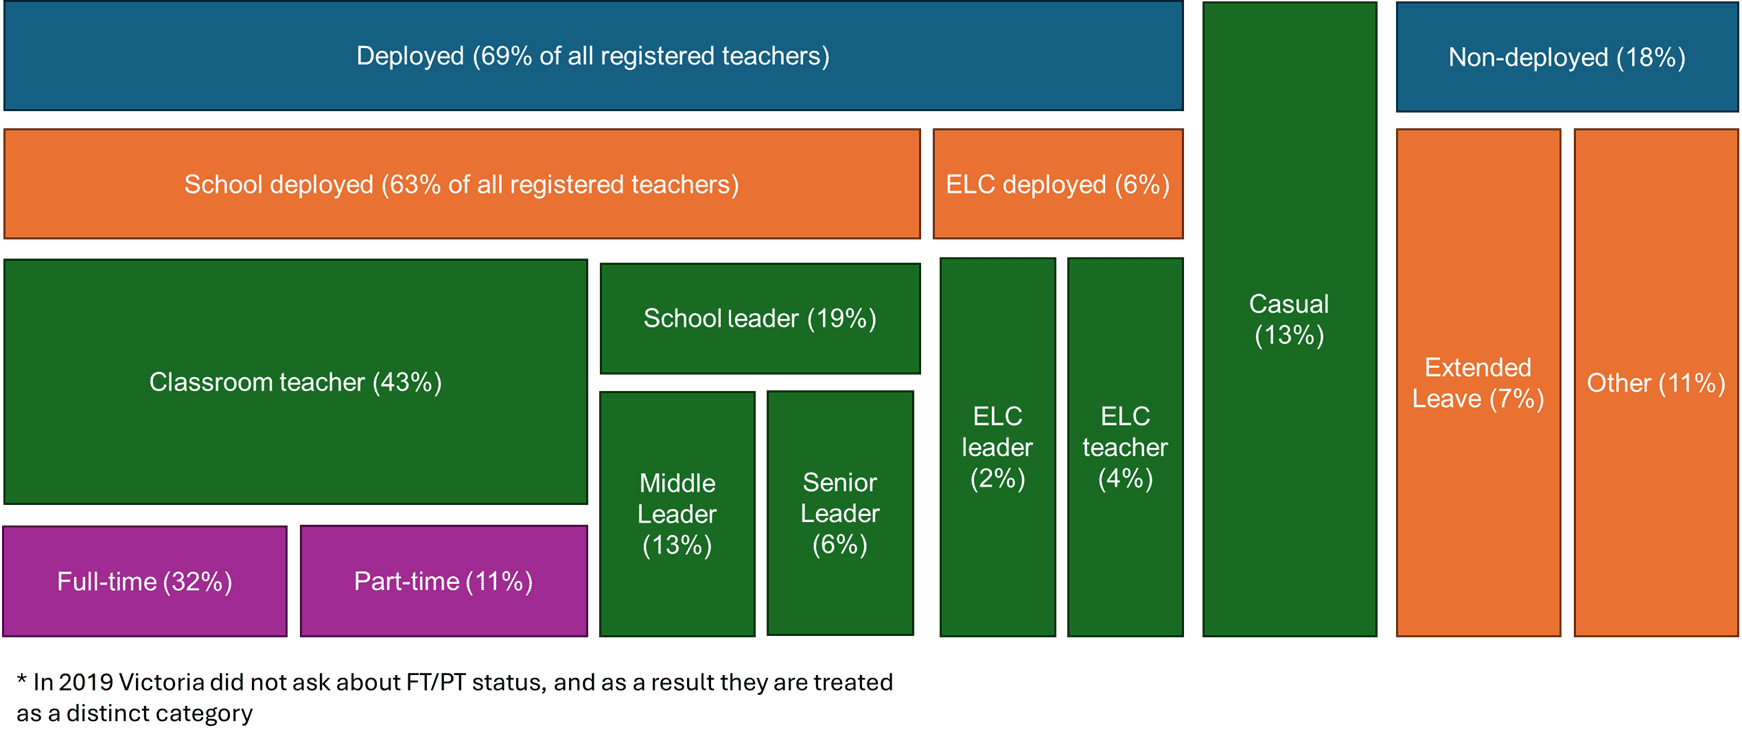
All teachers must be registered to teach or hold alternative authorisation to teach if they are teaching or leading in schools. Many early childhood teachers are also registered with teacher regulatory authorities, but this is not required for all teachers in all states and territories. To register as a teacher, individuals must be qualified with an accredited ITE qualification and meet the relevant requirements in accordance with the Australian Professional Standards for Teachers. However, not all registered teachers are necessarily working in the profession, with some employed elsewhere in education or outside of the sector, and others may not be participating in the workforce at all.
In 2022, 544,000 teachers were registered nationally. 18.7% of registered teachers were aged 60 or over, and approaching retirement age. 4.6% of registered teachers were already over retirement age.
| Regulatory authority | Number of teachers registered | Proportion also registered in another state/territory | Proportion of Australian population | Proportion of registrations |
|---|---|---|---|---|
| ACT | 8,887 | 8.5% | 1.8% | 1.6% |
| NSW | 184,043 | 4.8% | 31.4% | 32.8% |
| NT | 5,686 | 30.8% | 1.0% | 1.0% |
| QLD | 110,962 | 6.4% | 20.5% | 20.3% |
| SA | 36,456 | 3.8% | 7.0% | 6.5% |
| TAS | 11,242 | 7.3% | 2.2% | 2.0% |
| VIC | 143,042 | 3.9% | 25.5% | 25.5% |
| WA | 57,789 | Unknown | 10.7% | 10.3% |
The Teacher Workforce
Key findings
- In schools, the proportion of middle leaders declined slightly in 2022, whilst the proportion of classroom teachers remained constant.
- Primary schools remained the most common school type amongst the teacher workforce (deployed in schools) in 2022 (40%), followed by secondary schools (35%).
- In 2022, a majority of teachers were employed in government schools, whilst independent and Catholic school employment remained stable.
- The share of early career teachers returned closer to pre-pandemic levels in 2022, following a sharp decline during COVID-19 in 2021.
- In 2020, over nine in ten (94%) respondents completed their ITE qualification in Australia.
- The teacher workforce was less likely to be employed under an ongoing employment arrangement in 2022.
- In 2022, more classroom teachers had ongoing employment arrangements than in 2019.
- Face-to-face teaching hours initially decreased during COVID-19 for full-time classroom teachers but returned to pre-pandemic levels in 2022.
Education is central to Australia’s success as a nation (Productivity Commission, 2023) – and teachers are recognised as the number one in-school influence on student outcomes (Centre for Education Statistics and Evaluation, 2013). Understanding the characteristics and experiences of the Australian teacher workforce is essential to understanding trends in supply to build an effective, sustainable, supported, and high-quality teacher workforce that can deliver a world class education system.
This section focuses on the whole teacher workforce across schools and early learning centres, with additional data provided for those in schools. The characteristics of school leaders and casual relief teachers working in schools are explored in later sections.
Experience, registration status and qualifications
Australia’s teacher workforce is experienced, but there was an increase in the proportion of the teacher workforce who were newer to the profession from 2021 to 2022.
The ATWD currently has 3 years of fully national data from 2020 to 2022, but these years were affected by the COVID-19 pandemic. Any changes observed in the workforce experience composition may be due to the pandemic.
Compared to 2020 and 2021, the teacher workforce in 2022 had, on average, fewer years in the profession. In particular, there was a larger proportion of teachers with less than 20 years of experience, while there was a lower proportion with more than 30 years of experience, as of 2022.
- The proportion of teachers with 1 to 9 years of experience in the profession decreased by 6 percentage points from 2020 (37%) to 2021 (31%), and then rose by 4 percentage points in 2022 (35%). Additionally, teachers with 10 to 19 years of experience remained stable between 2020 and 2021 (26%), followed by 2 percentage-point increase in 2022 (28%).
- Those with 20-29 years of experience were a similar proportion of the workforce across the period from 2020 (17%) to 2022 (17%).
- The proportion of the teacher workforce with 30 to 39 years of experience increased by 2 percentage points from 2020 (13%) to 2021 (15%), followed by a 3 percentage-point in 2022 (12%). Similarly, those with 40 or more years of experience increased by 2 percentage points from 8% in 2020 to 10% in 2021, and then this proportion declined by 2 percentage points in 2022 (8%).
Table 5: Teacher workforce composition by years of experience
| Years of experience | 2020 | 2021 | 2022 |
|---|---|---|---|
| 1-9 | 37% | 31% | 35% |
| 10-19 | 26% | 26% | 28% |
| 20-29 | 17% | 17% | 17% |
| 30-39 | 13% | 15% | 12% |
| 40+ | 8% | 10% | 8% |
Very similar trends can be observed for classroom teachers with 1-9 years of experience, but they were of a greater magnitude. While 42% of classroom teachers had 1-9 years of experience in 2020 and 2022, this had decreased to 36% in 2021. This 6 percentage point increase for classroom teachers from 2021 to 2022 exceeded the 5 percentage point increase across the teacher workforce as a whole. However, for those with 10-19 years of experience, or 20-29 years of experience, there was no significant change in the proportion of classroom teachers from 2020 to 2022 (changes are less or equal to 2%).
The composition of the workforce in the period 2020 to 2022, may reflect the impact of COVID-19 on the workforce. During COVID-19, teachers nearing retirement may have elected to stay to help meet the needs of the profession, leading to more experienced workforce in 2021. With the relaxation of COVID-19 restrictions in 2022, those who may have left at the end of 2020 but continued through 2021 may have left in 2022, alongside those who would have ordinarily been expected to leave at the end of 2021.
The share of early career teachers returned closer to pre-pandemic levels in 2022, following a sharp decline during COVID-19 in 2021.
The proportion of early career teachers returned to its earlier levels in 2022, after experiencing a decline. During this decline, the proportion of early career teachers decreased by 5 percentage points from 2018 to 2021 (2018: 23%, 2019: 22%, 2020: 22%, 2021: 18%). Following this, early career teachers increased by 3 percentage points in 2022 (21%).
In 2020, over nine in ten (94%) respondents completed their ITE qualification in Australia.
In 2020, 94% of respondents who participated in the ATWD Teacher Survey had completed their ITE qualification in Australia, with the remaining 6% of respondents completing their ITE qualification overseas. The proportion of respondents with an overseas ITE qualification increased by 4 percentage points from 2019 (2%) to 2020 (6%).
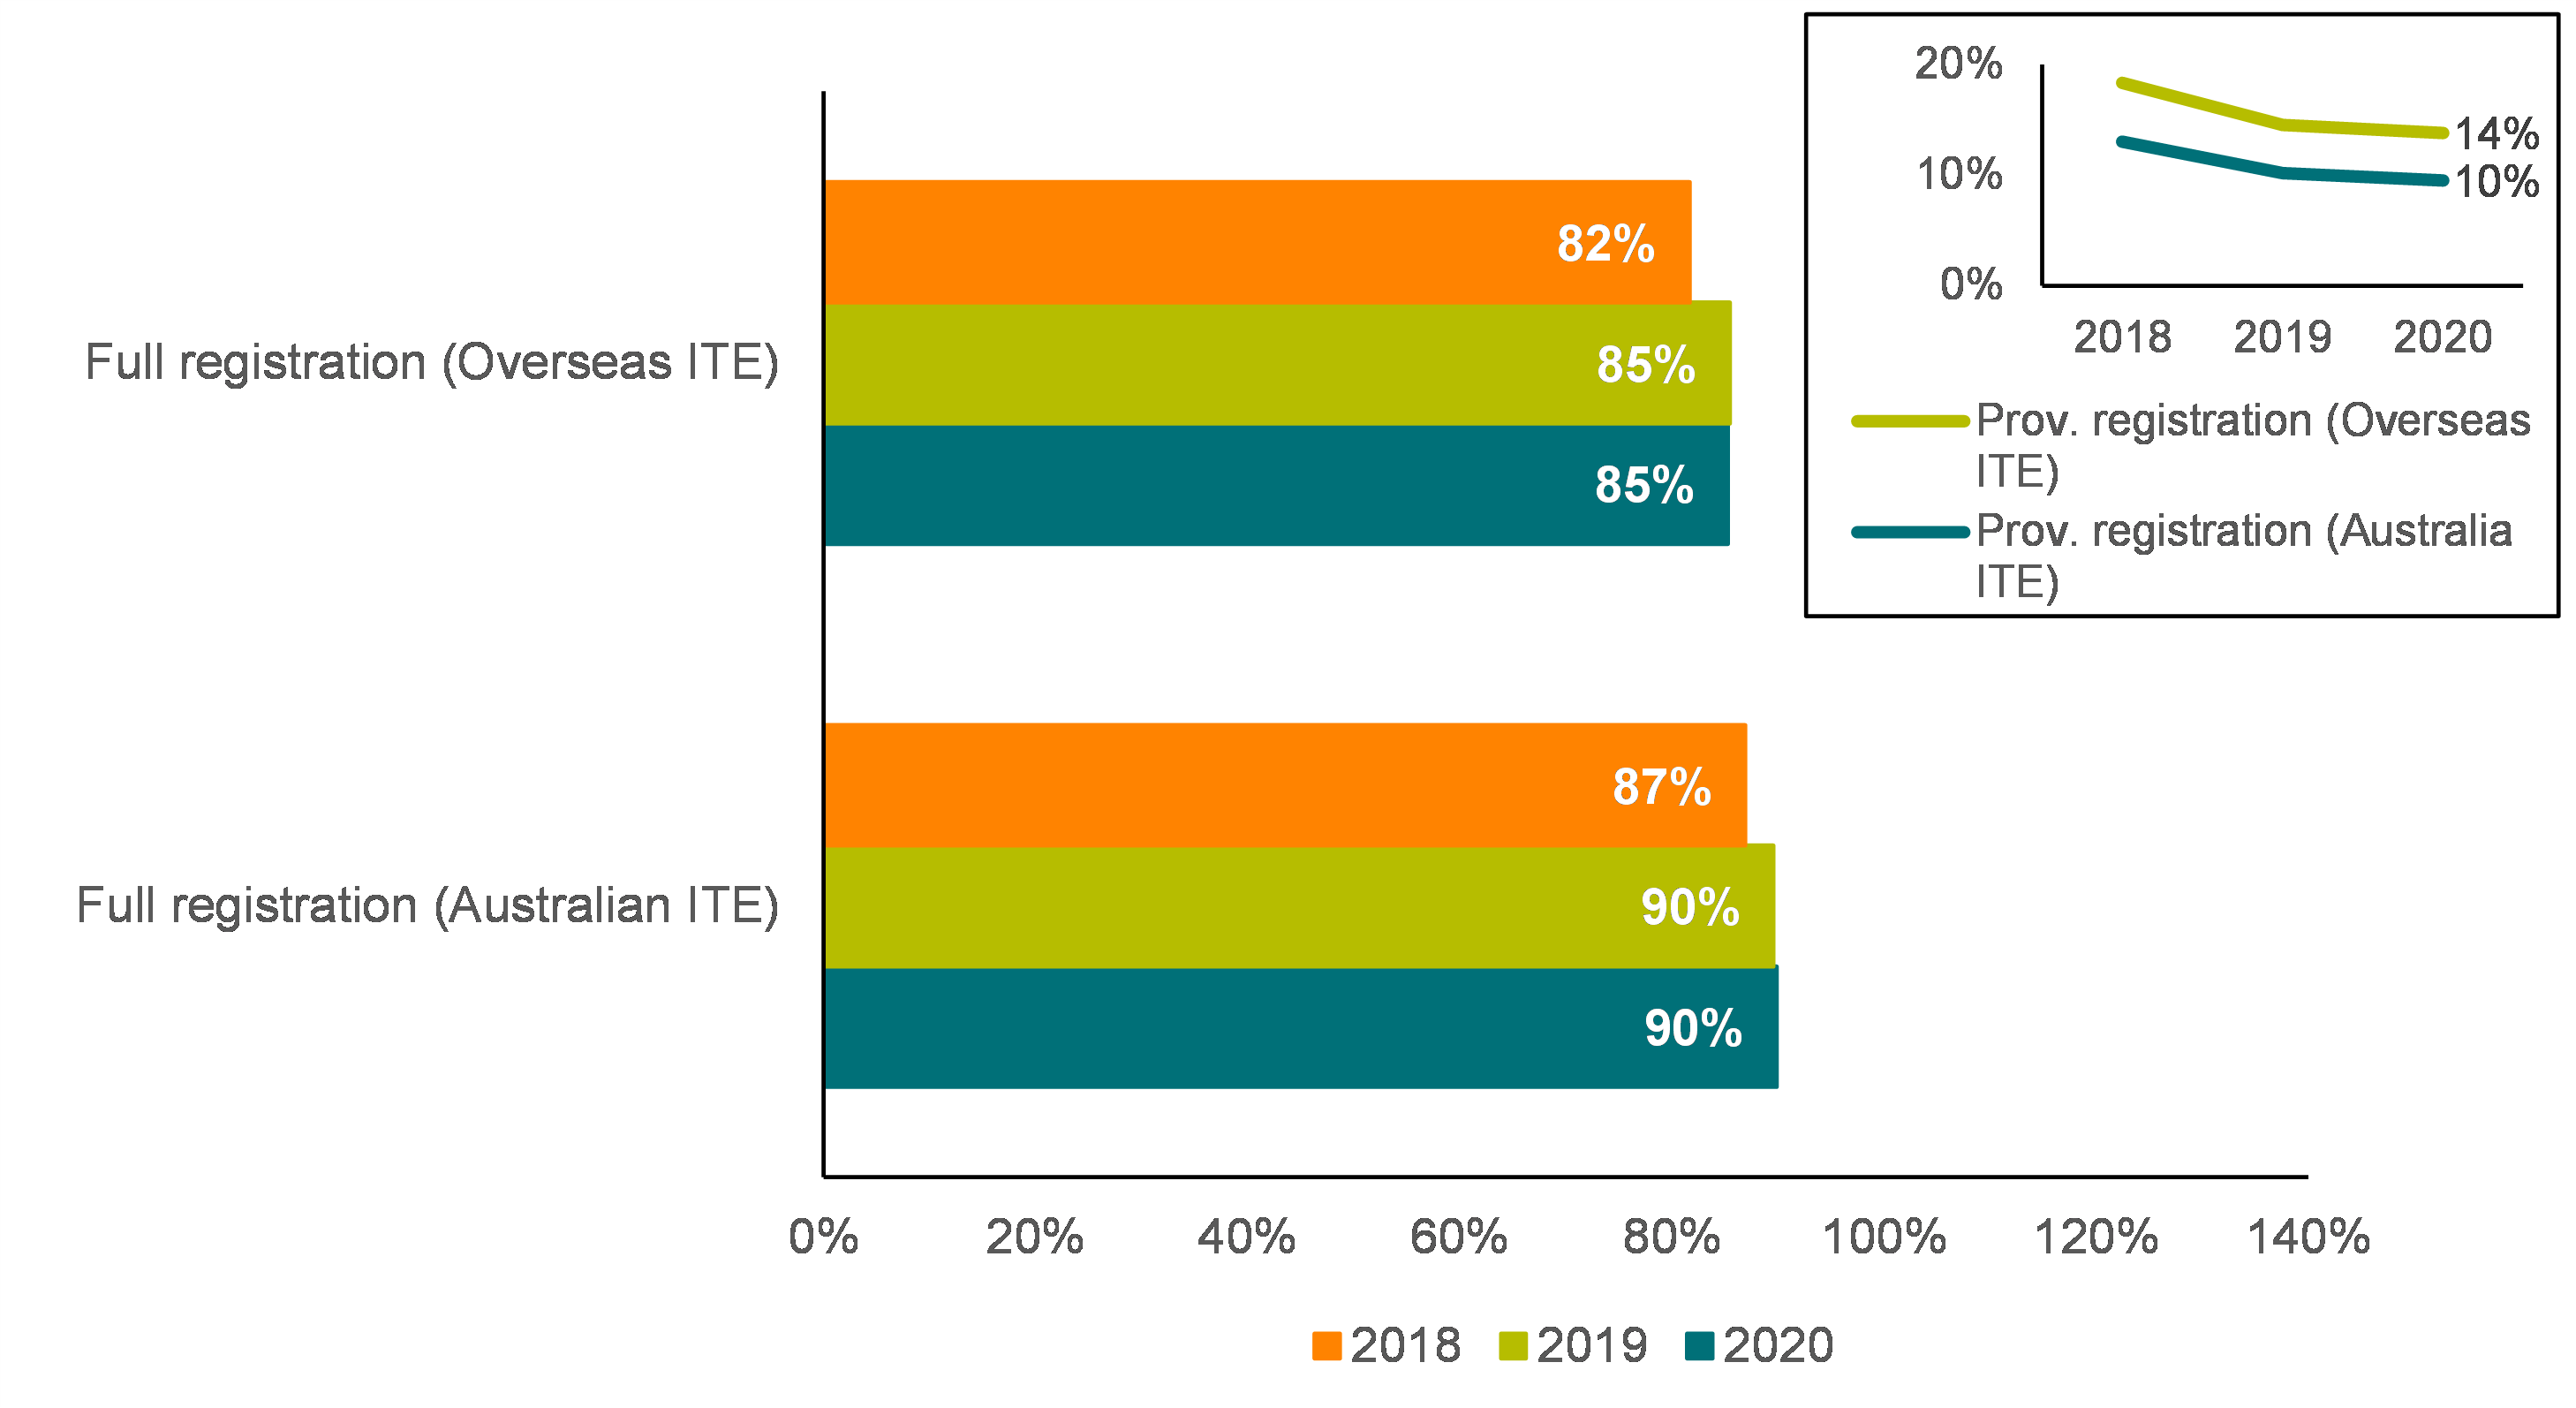
The teacher workforce is more likely to be fully registered if they completed initial teacher education (ITE) in Australia (83%) compared to overseas (77%). By contrast, provisional registration was more likely for teachers with overseas ITE qualifications (23%) than Australian ITE qualifications (17%).
Employment and contractual arrangements
The teacher workforce was less likely to be employed under an ongoing employment arrangement in 2022.
In 2022, just over two thirds (67%) of the teacher workforce had an ongoing employment arrangement, decreasing by 3 percentage points since 2019 (70%). The proportion of short fixed-term contracts (<1 year) decreased by 4 percentage points, dropping from 16% in 2019 to 12% in 2022. Long fixed-term contracts (>1 year) were the least frequent type of employment arrangements, but increased from 4% in 2019 to 5% in 2022. Just under one in six in the teacher workforce were employed under a casual or casual relief employment arrangement in 2022 (16%).
In 2022, more classroom teachers had ongoing employment arrangements than in 2019.
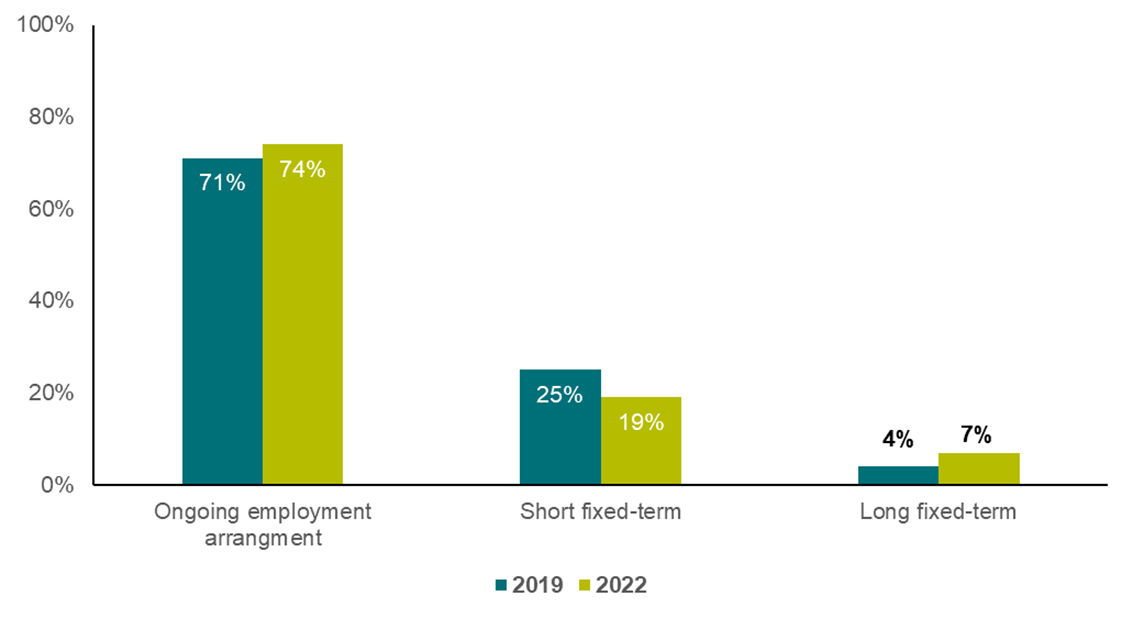
The share of classroom teachers with an ongoing employment arrangement has consistently increased, rising 3 percentage points from 2019 (71%) to 2022 (74%). The proportion of classroom teachers on short fixed-term contracts decreased 6 percentage points from 2019 (25%) to 2022 (19%). Long fixed-term contracts increased for classroom teachers from 2019 (4%) to 2022 (7%).
From 2018 to 2020, 53-58% of the teacher workforce were employed to work full-time hours. However, in 2021 and 2022, this increased to 71-72%. There was little change in most states and territories, but large changes in New South Wales and Queensland between 2020 and 2021, which account for the difference.Among the part-time workforce, between 2018 and 2019, teachers were contracted to work a median of 35 and 40 hours per week. This fell back to 35 to 36 hours per week between 2020 and 2022.
Overall, median working hours remained stable in the 2020-2022 period for both full-time and part-time classroom teachers, at 50 and 35 hours, respectively. This reflects the stable working hours for both full-time and part-time teachers over the given period. For classroom teachers, the proportion working full-time was very similar to the teacher workforce as a whole, ranging between 56% and 62% in the years 2018 to 2020, followed by a large increase to 73% in 2021, and a small increase to 74% in 2022.
School leadership
Key findings
- Men are over-represented among school leaders.
- Leadership only roles increased sharply for both senior and middle leaders from 2018 to 2022.
- The majority of senior and middle leaders were employed under an ongoing employment arrangement in 2022.
- Full-time leaders continued to work consistently higher hours than contracted, despite a small reduction since 2020.
- Leaders have undertaken more diverse tasks recently, with senior leaders interacting with parents more, and spending more time on professional learning for staff, than middle leaders.
- In 2022, senior leaders were twice as likely to work in remote or very remote schools, and more likely to work in outer regional areas, than classroom teachers and middle leaders.
- Middle leadership and senior leadership roles were most commonly held by those with 10-29 and 30-39 years of experience, respectively.
- The critical window for transitioning into middle leadership is at 10-19 years of experience, followed closely by 20-29 years of experience.
There is clear evidence that teaching and school leadership are the most influential in-school factors affecting student outcomes (Leithwood et al., 2020). Across all educational settings, leaders play an important role in ensuring high-quality teaching and learning, which enhances student outcomes by building a positive organisational culture and supporting continuous improvement (AITSL 2018). Leaders may be responsible for instructional leadership, leading and developing teachers and support staff, engaging with the local community, and overseeing the administration and operation of a school or early childhood service (amongst other responsibilities).
Leaders can hold a variety of positions that encompass middle leadership and senior leadership roles. Leaders are typically experienced teachers and may continue to hold a teaching position alongside their leadership role or responsibilities.
This section presents the following ATWD data and information on leaders:
- a snapshot of their demographics
- leaders’ duties, working hours and employment arrangements
- leaders’ experience, career progression and leadership opportunities
Career progression and leadership opportunities
Experience levels
The distribution of experience across middle and senior leaders has changed moderately over time, shifting towards less experienced leaders while maintaining a strong overall experience base. This is likely a reflection of aging school leadership at the highest levels of experience (30 or more years of experience).
In 2022, 29% of senior leaders reported having 30 or more years of experience, which declined from 32% in 2020 (2021: 36%). Middle leaders with over 30 years of experience accounted for 20% of middle leaders in 2022, declining from 21% in 2020 (2021: 24%).
As a result of a fall in numbers for the most experienced senior leaders, the proportion of senior leaders with 10-29 years of experience increased from 57% in 2020 and 2021 to 62% in 2022. This trend is also reflected in middle leaders, where 58% had 10-29 years of experience in 2022, up from 54% in 2020 (2021: 55%).
From 2020 to 2022, there was a slight decrease in the proportion of senior leaders who had been in a leadership role for 10 years or more (2020: 32%; 2022: 28%). At the same time, the proportion of senior leaders with less experience, who had been leading for 1 to 2 years, increased by three percentage points (2020: 21%; 2022: 24%).
In 2022, senior leaders were twice as likely to work in remote or very remote schools, and more likely to work in outer regional areas, than classroom teachers and middle leaders.
Senior leaders were twice as likely to work in remote or very remote schools (2022: 4%), compared to classroom teachers (2022: 2%), and middle leaders (2022: 2%). This pattern partially extended to schools in outer regional areas, where a greater proportion of senior leaders worked (2022: 11%), compared to classroom teachers (2022: 9%), and middle leaders (2022: 8%). Inner regional areas had the highest proportion for middle leaders (2022: 20%) by 1 percentage point, while major cities had the highest proportion of classroom teachers (2022: 71%), which was 5 percentage points above senior leaders (2022: 66%), who made up the lowest percentage of the teacher workforce in major cities.
Between 2020 and 2022, the proportion of senior leaders remained nearly stable in inner regional areas (2020: 20%, 2022: 19%), and remote and very remote areas (2020: 5%, 2022: 4%). However, there was a three-percentage point increase in the proportion of senior leaders in major cities (2020: 63%, 2022: 66%), while the proportion of senior leaders in outer regional areas remained almost unchanged (2020: 12%, 2022: 11%). The proportions of middle leaders increased by a small degree in inner regional areas (2020: 18%; 2022: 20%), while this proportion in outer regional areas did not change (2020: 8%; 2022: 8%). Changes for classroom teachers were similarly low, with minor changes occurring in outer regional areas (2020: 10%; 2022: 9%), major cities (2020: 70%, 2022: 71%), remote and very remote areas (2020: 2%, 2022: 2%). There was a slight increase of 2 percentage points in the proportion of middle leaders in major cities (2020: 69%; 2022: 71%).
These mostly static figures suggest no meaningful changes have occurred in the remoteness of school leaders and others in the teaching workforce in recent years, despite the potential impacts of internal migration. They also suggest the large disparities between the percentage of senior leaders, middle leaders, and classroom teachers in remote or very remote schools. These are longstanding trends and suggest a greater prevalence of senior roles in smaller schools.
Middle leadership and senior leadership roles were most commonly held by those with 10-19 and 30-39 years of experience, respectively.
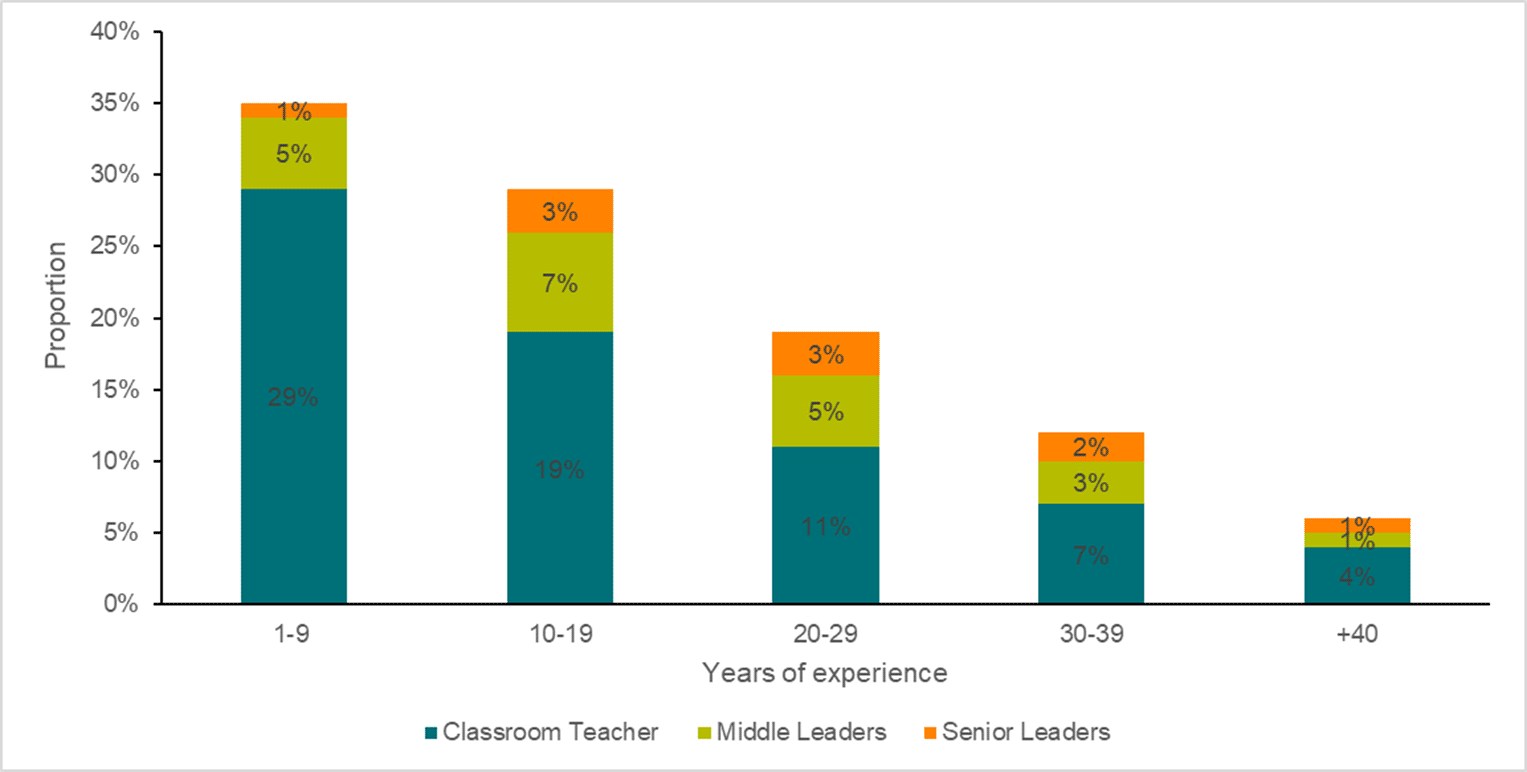
Over one-in-three (36%) registered teachers in schools with six or more years of teaching experience had secured a leadership position by 2022. For the cohort of middle leaders in 2022, those with 10-19 years of experience were most common (35% of all middle leaders), followed by those with 20-29 years of experience (23%). Middle leaders with 30-39 years of experience were less common (14%). Early career teachers made up only 7% of middle leaders; with leadership positions in the early stages of a career more likely in regional and remote areas (Graham et al. 2009).
The greatest proportion of senior leaders were those with 30-39 years of experience in the profession, sitting at 18% in 2022. In contrast to middle leaders, the rate of uptake of senior leadership positions was more gradual, with a small increase at the 6-9 years of experience level (4%), before rising to 11% for those with 10-19 years of experience and 16% for those with 20-29 years of experience in the profession. Less than 1% of senior leaders were early career teachers.
Amongst the teacher workforce with over 40 years of experience in the profession, there was a slight decline in both middle (2022: 21%) and senior leaders (2022: 15%), which may indicate a preference to reduce leadership responsibilities at the latter end of teaching careers.
Figure 4: The proportion of all registered teachers (deployed in schools and excluding CRTs) who are leaders, in each level of experience bracket, 2022
Note. The dark portion of each line represents the years of experience for which the proportion of middle (or senior) leaders is increasing.
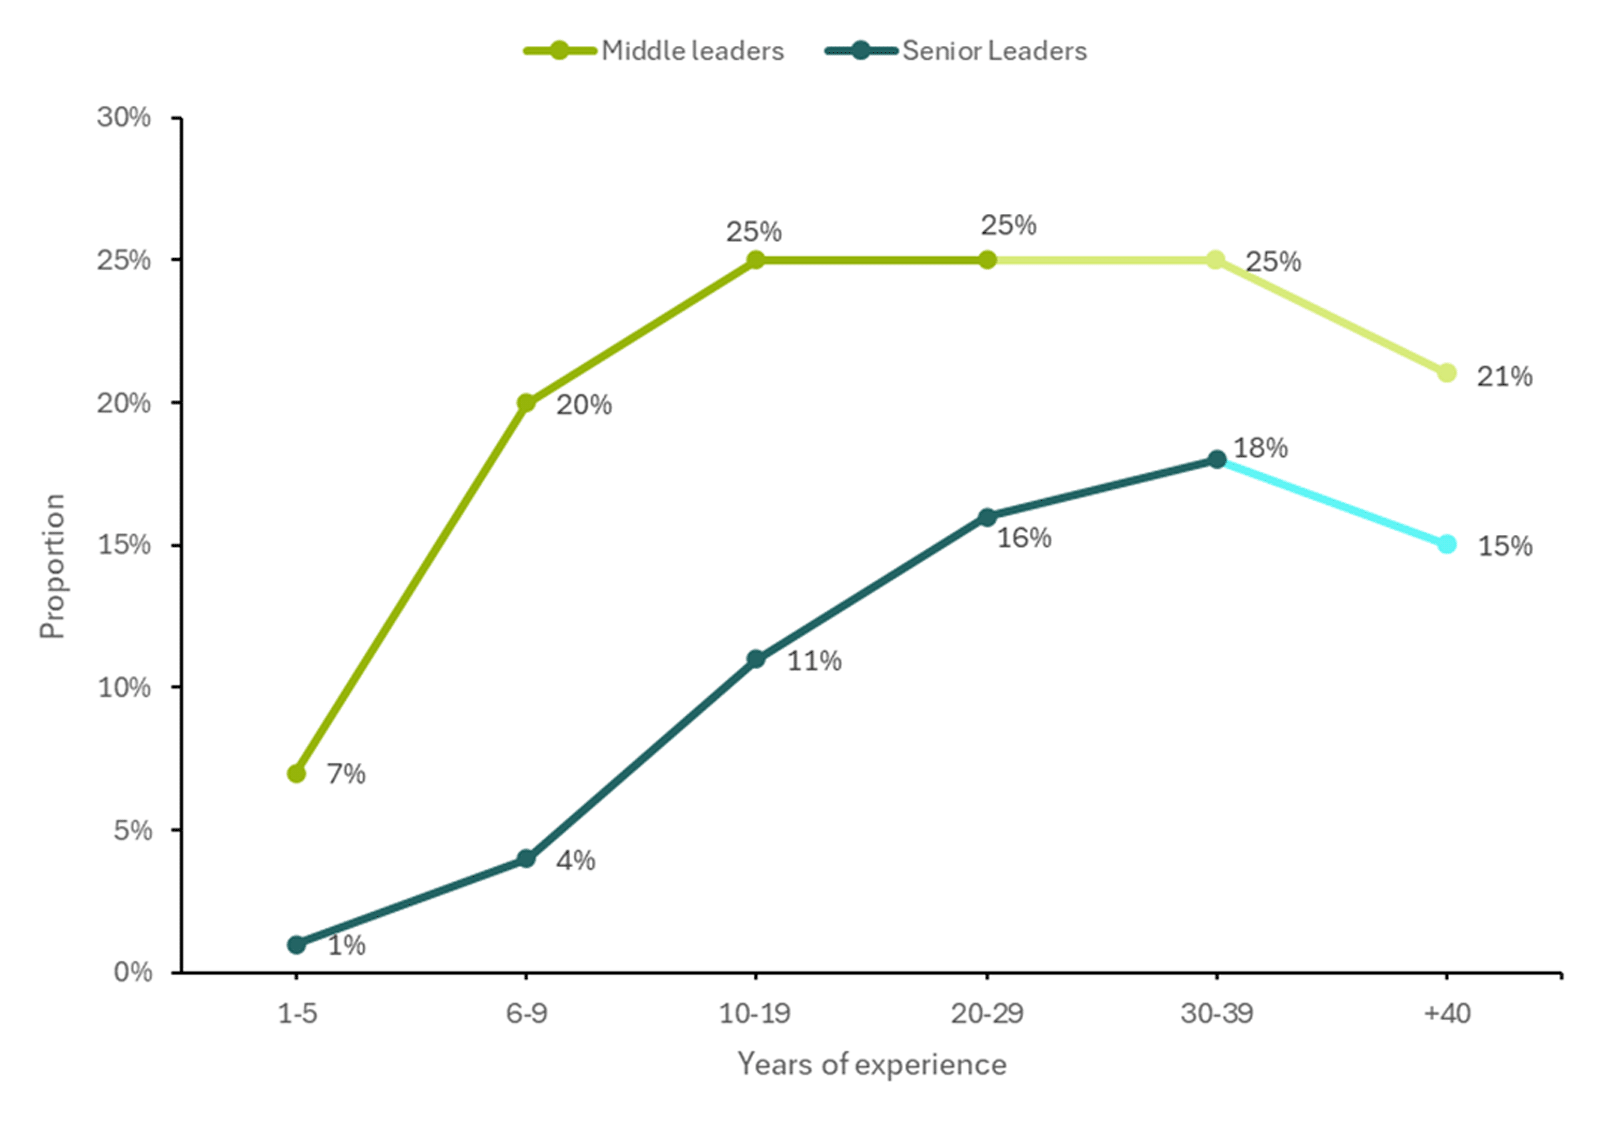
The critical window for transitioning into middle leadership appears to be at 10-19 years of experience, followed closely by opportunities at 20-29 years of experience.
It can be assumed that many individuals progress through a leadership trajectory by moving into senior leadership from a middle leadership position, especially in larger schools. Typically, opportunities exist for classroom teachers to progress into middle leadership from 10-19 years of teaching, before progressing into senior leadership roles with 20-40 years of experience. The data in Figure 4 above shows the proportion of middle leaders peaking at 10-19, 20-29, and 30-39 years of experience, suggesting that the most common entry point is somewhere between 10 and 19 years. Unsurprisingly, the transition to senior leadership tends to happen later, with the proportion of senior leaders peaking at 30-39 years experience.
Early career teachers
Key findings
- Casual employment among early career teachers has slightly decreased from 2020 to 2022, but rates of long-fixed term contracts (> 1 year) and permanent/ongoing employment have increased.
- Between 2020 and 2022, the proportion of all early career teachers who reported receiving a formal induction decreased, with a larger decrease for those with less experience.
- The breadth of induction opportunities received decreased for all early career teachers between 2020 and 2022.
To examine the opportunities for early career teachers working in schools to be employed as a classroom teacher, the types of employment obtained by early career teachers were assessed.
Over time, the proportion of early career teachers in schools who are working as classroom teachers has remained relatively stable, at 88% in 2019, 2020 and 2021, slightly increasing to 89% in 2022. This suggests that it may be becoming easier for early career teachers to find employment, and that fewer are required to work as CRTs.
Casual employment among early career teachers has slightly decreased from 2020 to 2022, but rates of long-fixed term contracts (> 1 year) and permanent/ongoing employment have increased.
The rates of casual employment were slightly higher for early career teachers in 2022 (18%) than the whole teacher workforce (16%). This has been steady since 2018.
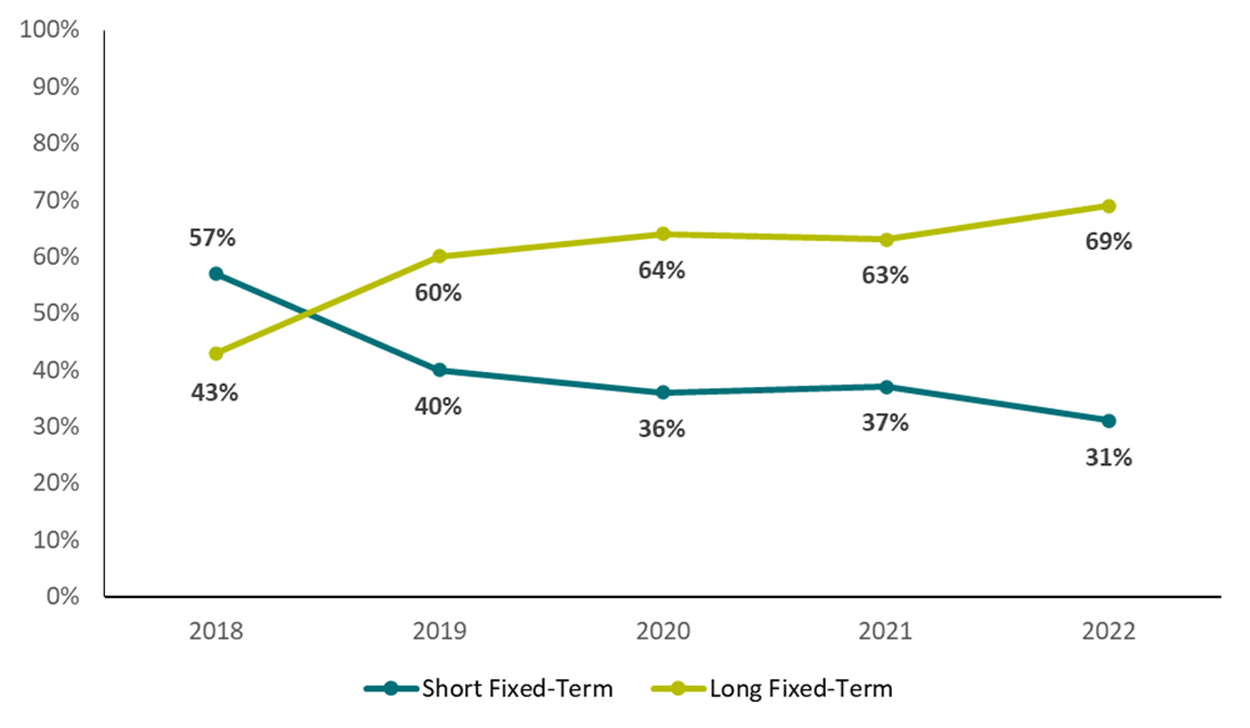
For early career teachers who do gain employment in schools or early childhood, and are not working as a CRTs, the proportion on longer term contracts (fixed term > 1 year, or ongoing) has increased over time from 64% in 2020 to 69% in 2022 (see Figure 6). This indicates that early career teachers have been increasingly able to attract a greater level of stability and security in employment arrangements.
Between 2020 and 2022, the proportion of all early career teachers who reported receiving a formal induction decreased, with a larger decrease for those with less experience.
During a formal induction, early career teachers with up to 5 years of experience build on knowledge and experiences from their initial teacher education program, and/or on prior induction experiences that may have been received at other schools. Formal induction is important because it can introduce early career teachers to the school community, working culture, and teaching environment, while enabling them to enhance their pedagogy, their professional identity, and other professional skills.
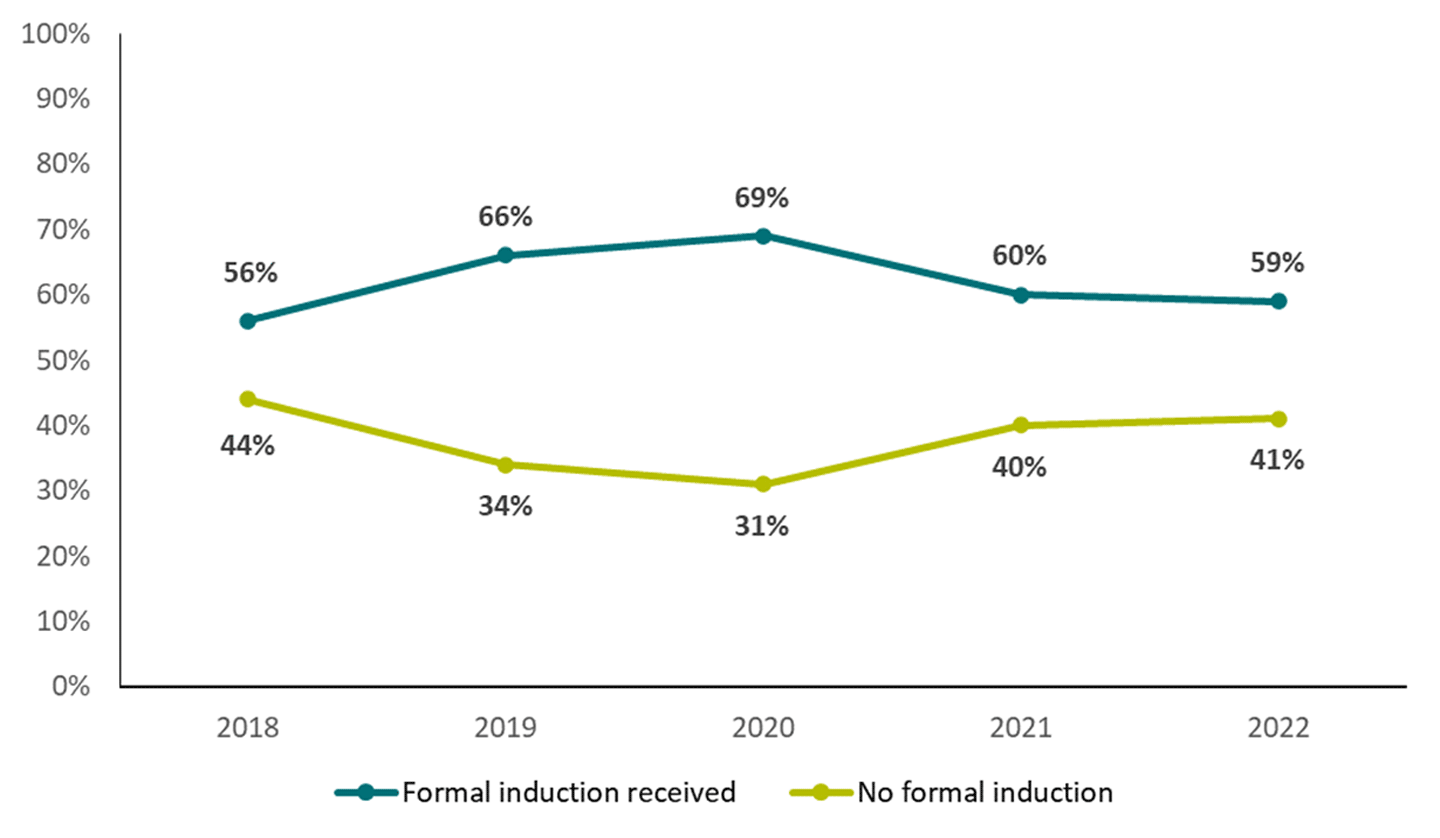
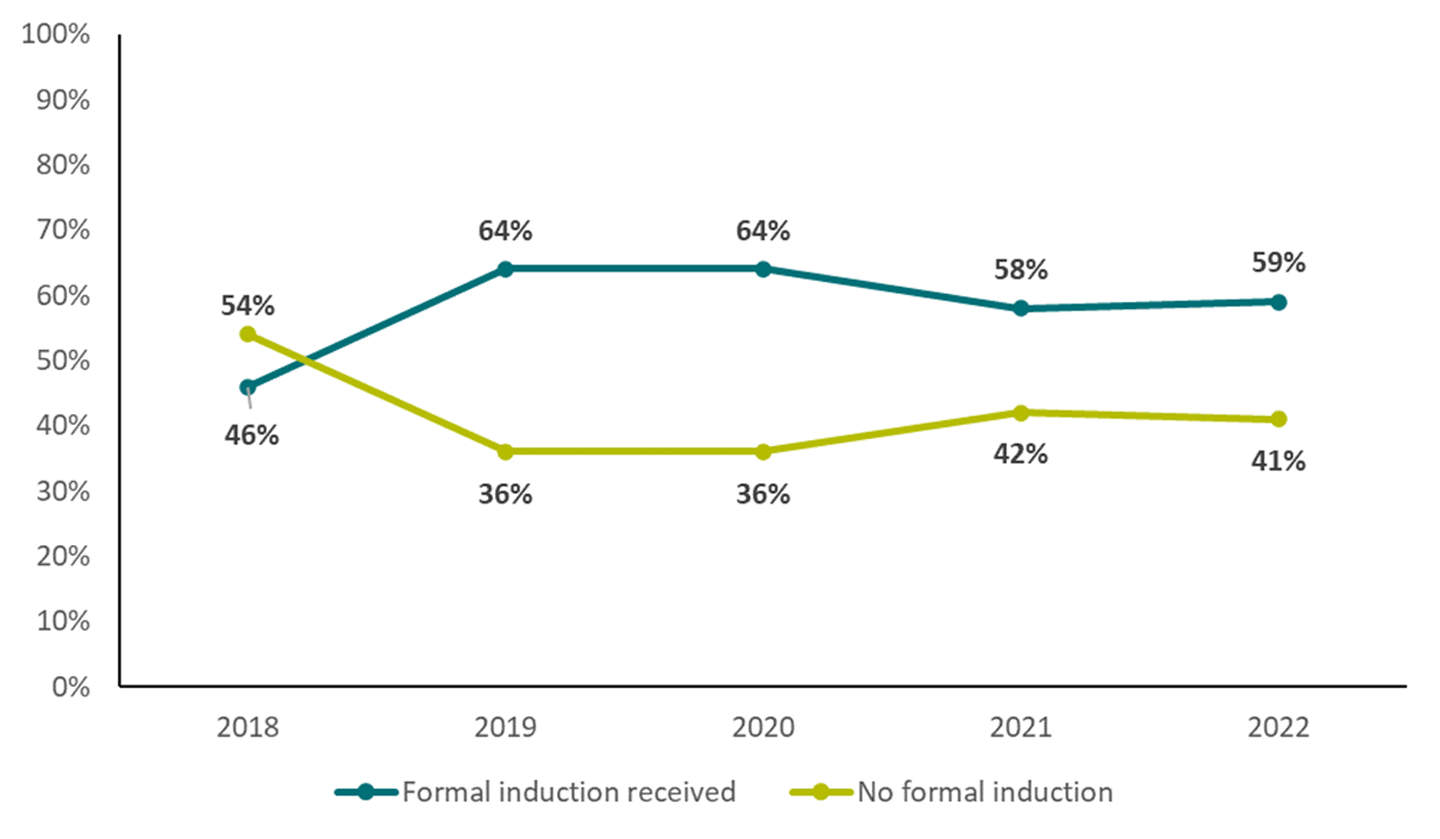
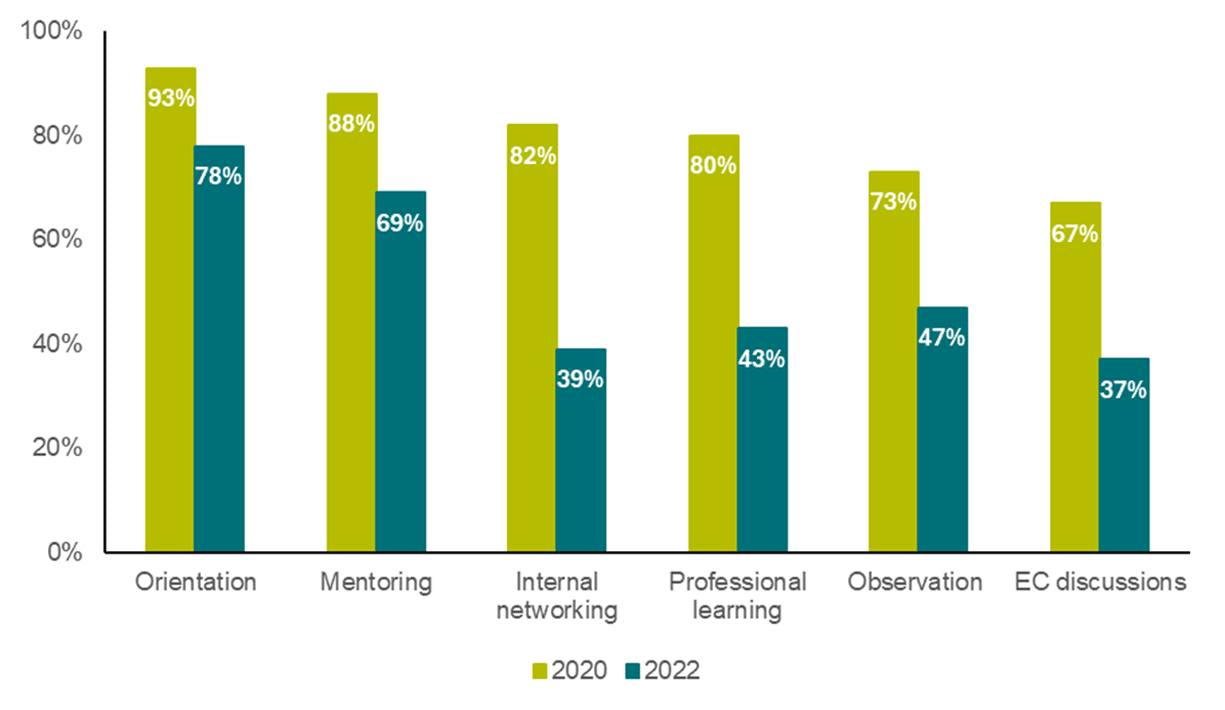
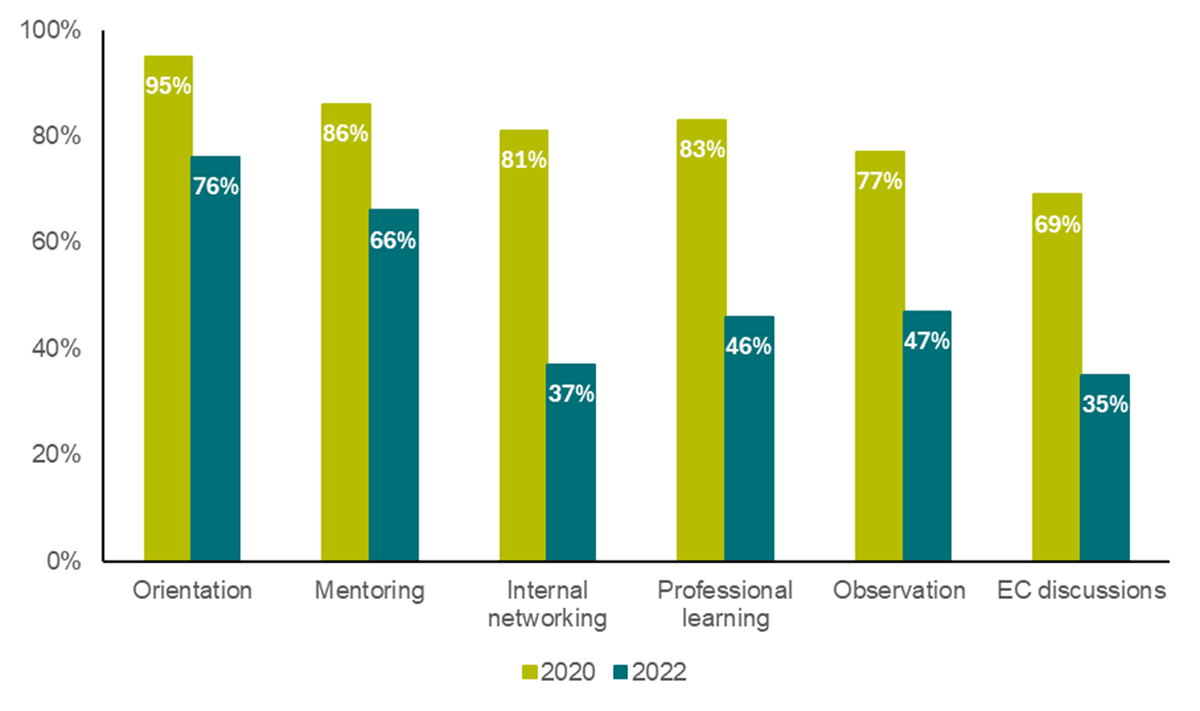
Between 2020 and 2022, the percentage of early career teachers with 1 – 2 years of experience who reported receiving a formal induction dropped 10 percentage points (2020: 69%; 2022: 59%). During the same time period, the percentage of early career teachers with 3 – 5 years of experience who reported receiving a formal induction dropped by 5 percentage points (2020: 64%; 2022: 59%). These decreases removed the difference in the likelihood of receiving a formal induction for those with 1 -2 years experience and 3 – 5 years experience (both at 59% in 2022).
(a) 1-2 years of experience
The breadth of induction opportunities received decreased for all early career teachers between 2020 and 2022.
Detailed information on induction experiences are collected for all teachers who received a formal induction.
Early career teachers (3 – 5 years of experience)
Between 2020 and 2022, more experienced early career teachers with 3 – 5 years of experience had large percentage declines across every available induction experience. Large declines were recorded across many induction experiences, including:
- Internal networking (2020: 81%; 2022: 37%, -44 percentage points)
- Targeted professional learning opportunities (2020: 83%; 2022: 46%; -37 percentage points)
- Structured opportunities for discussions with other educators (2020: 69%; 2022: 35%, -34 percentage points)
When these percentages factor-in formal induction, they equate to similarly large declines in internal networking (2020: 52%; 2022: 22%), targeted professional learning (2020: 53%; 2022: 27%), and structured opportunities for discussions (2020: 44%; 2022: 20%) for all early career teachers with 3 – 5 years of experience (i.e., regardless of whether they received a formal induction). Declines in induction experiences amongst early career teachers with 3 – 5 years of experience were also recorded for teacher observation (2020: 77%; 2022: 47%), orientation (2020: 95%; 2022: 76%) and mentoring (2020: 86%; 2022: 66%).
Early career teachers (1 – 2 years of experience)
Over the same time period from 2020 to 2022, less experienced early career teachers with 1 – 2 years of experience also had large declines across each available induction experience. The induction experiences with the largest declines were the same as those above, including:
- Internal networking (2020: 82%; 2022: 39%, -43 percentage points)
- Targeted professional learning opportunities (2020: 80%; 2022: 43%; -37 percentage points)
- Structured opportunities for discussions with other educators (2020: 67%; 2022: 37%, -30 percentage points)
When these percentages also factor-in formal induction, they equate to declines in internal networking (2020: 57%; 2022: 23%), targeted professional learning (2020: 55%; 2022: 25%), and structured opportunities for discussions (2020: 46%; 2022: 26%) for all early career teachers with 1 – 2 years of experience (i.e., regardless of formal induction). Declines in induction experiences amongst early career teachers with 1 – 2 years of experience were also recorded for teacher observation (2020: 73%; 2022: 47%), mentoring (2020: 88%; 2022: 69%) and orientation (2020: 93%; 2022: 78%).
These declines in induction experiences for both more and less experienced early career teachers likely reflects a strong constraint in available resources amongst the teacher workforce. Particularly over the period from 2020 to 2022, the teacher workforce has seen a strong increase in non-teaching duties, which has likely impacted upon the ability and capacity to deliver induction experiences to early career teachers.
In addition, one potential reason for the larger declines in induction experiences for early career teachers with 3 – 5 years of experience is that schools have placed a greater emphasis on experiences better suited to less experienced teachers with 1 – 2 years of experience. These include observations, orientation, and mentoring, which schools may have prioritised at the expense of networking, more targeted learning, and structured opportunities for discussions, which are better suited to more experienced early career teachers.
Regional and remote teacher workforce
Key findings
- In 2022, the very remote teacher workforce was more likely to be older, and slightly less likely to be female, compared to those in major cities, inner and outer regional, and remote areas.
- The regional and remote teacher workforce are slightly more likely to be employed in permanent roles compared to 2020.
- In 2020, the most remote and very remote teachers were more likely to be employed full-time than their counterparts in other areas.
- Leaders in regional and remote areas were more likely to have fewer years of leadership experience than those in metropolitan areas in 2020. In 2022, the experience levels of leadership in regional and remote areas were similar to those in metropolitan areas.
- Intentions to leave the profession prior to retirement increased for both the metropolitan teacher workforce and regional and remote teacher workforce from 2020 to 2022.
- ‘Workload and coping’ remains the top category of reasons for leaving for those in the regional and remote teacher workforce as well as teachers in major cities.
Nearly a third of teachers work in rural, regional or remote settings, educating over a quarter of Australia’s students. Yet schools in these areas often have difficulty in recruiting and retaining teachers relative to the overall workforce, particularly those with experience (SPERA, 2023). This has long-term impacts on student achievement, with international standardised testing revealing large differences in students from metropolitan schools and those in more remote schools (Thomson et al. 2016). Given the additional challenges and barriers associated with educational settings in rural, regional and remote areas, the ongoing professional support of teachers and leaders in these schools should be explicitly considered in workforce planning and policy making.
This section presents selected data on the regional and remote teacher workforce in Australia. It includes trend data based on workplace remoteness from 2018 to 2020, providing insights into workforce trends in regional and remote areas, compared to their metropolitan counterparts. Further regional views of the data in 2020 are available through the ATWD Data Explorer.
In 2022, the very remote teacher workforce was more likely to be older, and slightly less likely to be female, compared to those in major cities, inner and outer regional, and remote areas.
In 2022, the proportion of women in the teacher workforce in schools was relatively consistent across areas, with women most likely to be in major cities and outer regional areas (75%), followed by inner regional and remote areas (74%), and very remote areas (73%).
Compared to gender, differences in age were more pronounced. The proportion of teachers 50 years of age and over was highest in very remote areas (38%), followed by inner and outer regional areas (both 36%), major cities (34%), and remote areas (31%). These differences, particularly between very remote and both major cities and remote areas, suggest that age was a main demographic point of difference across the teacher workforce in these areas in 2022.
Employment arrangements and positions
The regional and remote teacher workforce are slightly more likely to be employed in permanent roles compared.
From 2020 to 2022, the employment of teachers in regional and remote areas in permanent ongoing roles slightly increased (+2 percentage points; 2020: 71%; 2022: 73%), bringing them more on par with the metropolitan workforce in similar employment arrangements (2022: 74%). This corresponded with a decrease in the proportion of the regional and remote teacher workforce employed on short fixed-term contracts of less than one year (-3 percentage points: 2020: 23%; 2022: 20%).
In 2020, the most remote and very remote teachers were more likely to be employed full-time than their counterparts in other areas.
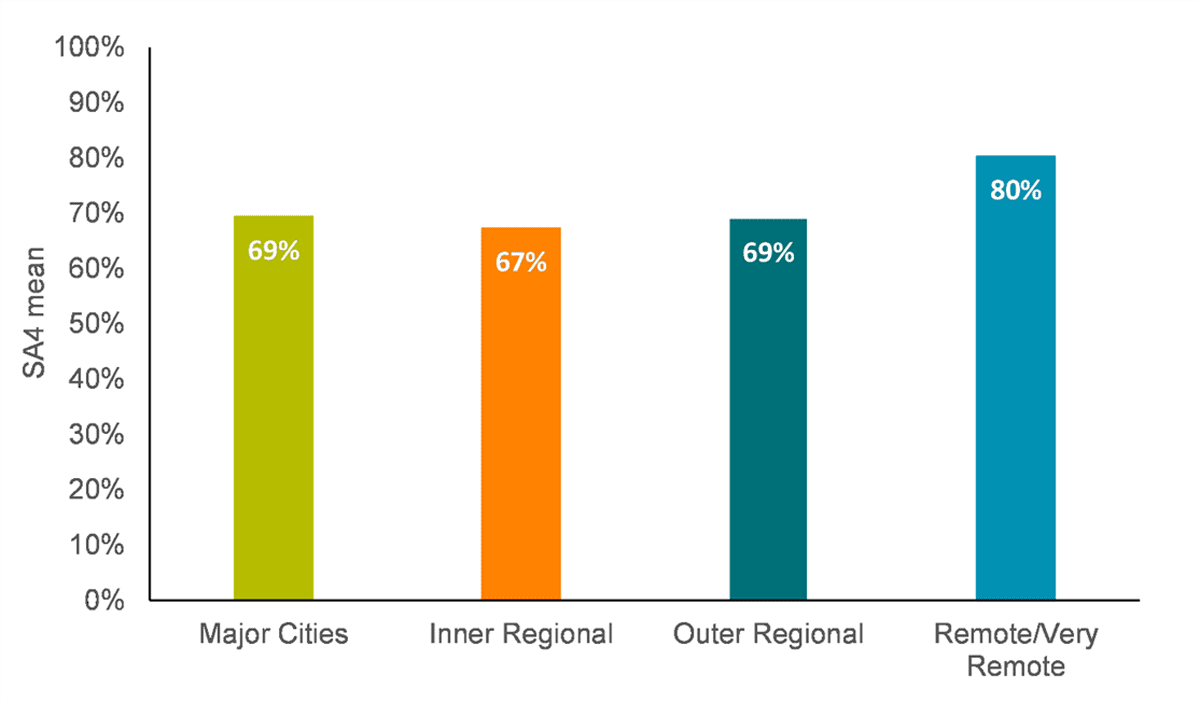
In 2020, the proportion of teachers in full-time employment varied across Statistical Area Level 4 (SA4) regions where most schools in a geographic area were located. As shown in Figure 9, average rates of full-time employment in the teacher workforce were broadly comparable across SA4s for major cities, inner regional, and outer regional areas (67-69%). However, teachers in the most remote areas were around 11-13 percent more likely to be employed full-time than their counterparts in major cities, inner regional, and outer regional areas (80%).
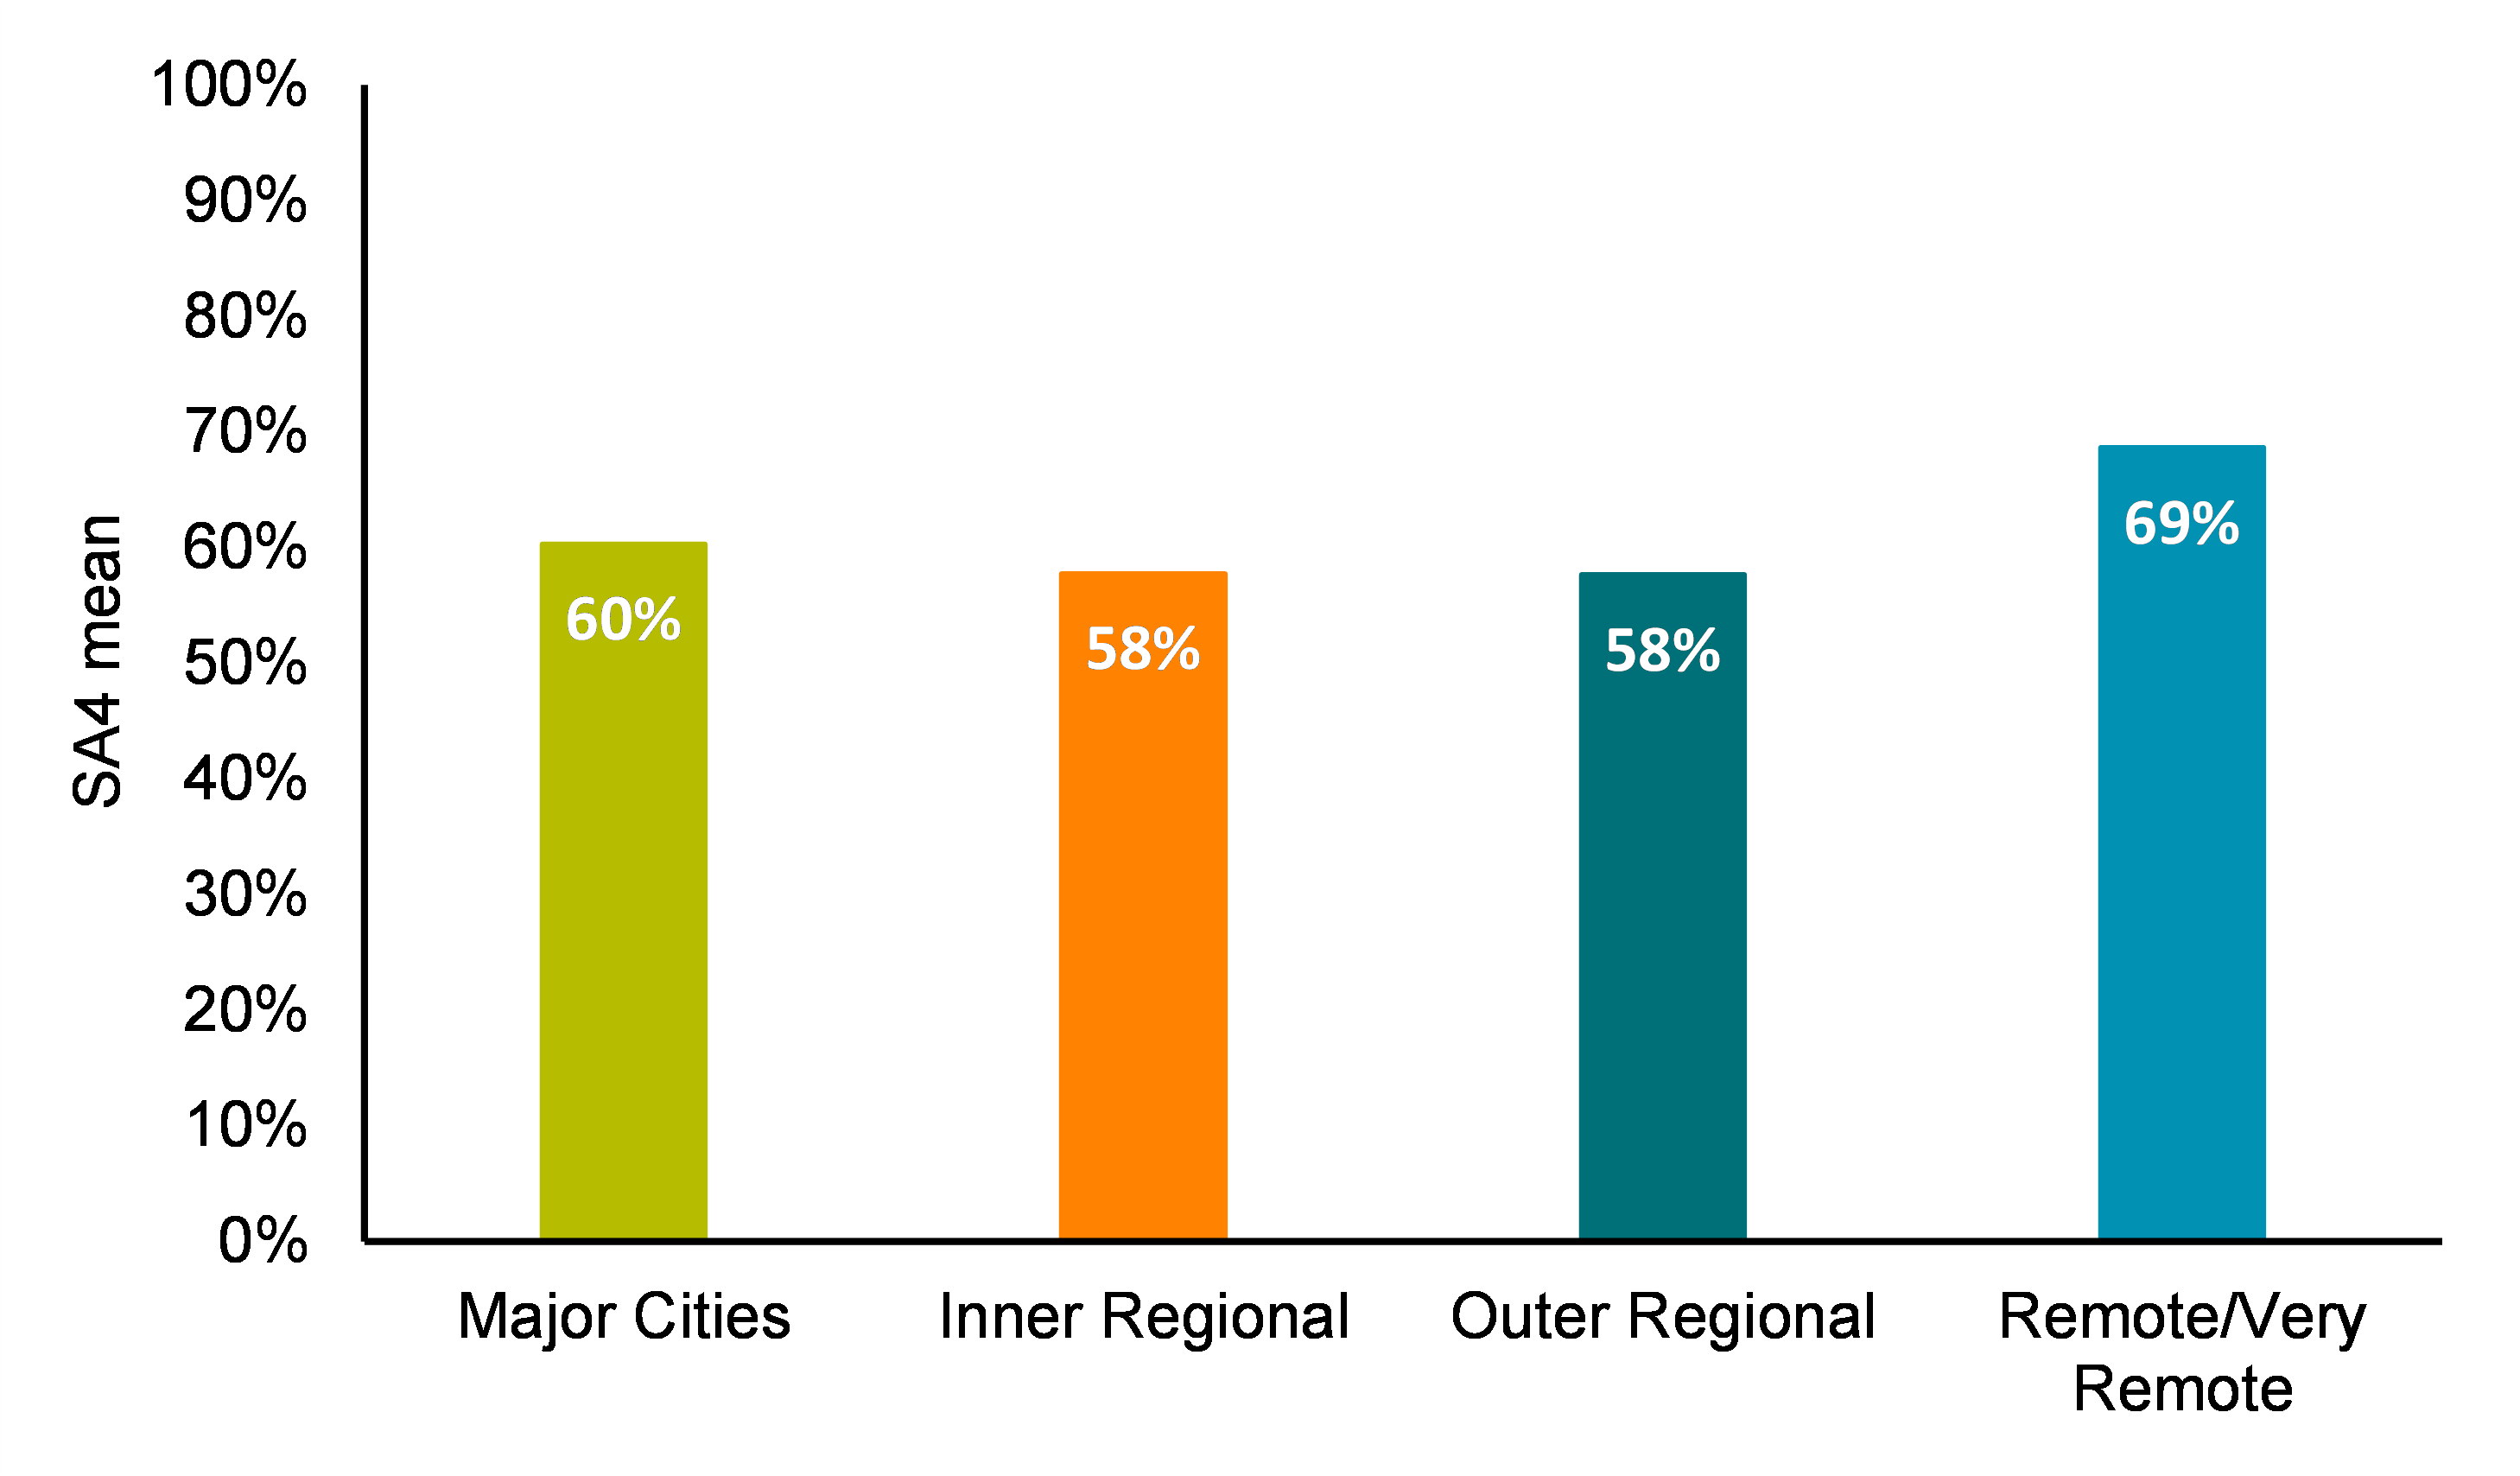
In addition, average hours worked were also broadly comparable across SA4s for major cities, inner regional, and outer regional areas. However, as shown in Figure 10, the teacher workforce in the most remote areas were around 10 percent more likely to work 50 plus hours per week, compared to their counterparts in major cities, inner regional, and outer regional areas. The first and most straightforward explanation for this difference in hours is the higher percentage of full-time teachers in remote and very remote areas. This is because, as a greater proportion of these teachers work full-time, it is reasonable to assume that this will impact and be reflected in higher average hours worked per week (assuming all else remained equal).
However, this overall increase in average hours does not explain why remote and very remote teachers are also working more than their full-time contracted hours, or why they are more likely to have full-time work. One possible explanation is that more pronounced teacher shortages in the most remote and very remote areas have contributed to a consistent increase in both full-time work and hours over time. While this may be beneficial to some teachers as it provides more job security, it may also be detrimental because of the additional hours involved, which may disincentivise working in remote and very remote areas.
Leaders in regional and remote areas were more likely to have fewer years of leadership experience than those in metropolitan areas in 2020. In 2022, the experience levels of leadership in regional and remote areas were similar to those in metropolitan areas.
Leaders in regional and remote areas tend to be starting out in their leadership position, with fewer years’ experience compared to their metropolitan counterparts. In 2020, 55% of leaders in regional and remote areas had 5 years or less leadership experience compared to 46% in major cities. In 2022, the proportions are comparable, with 55% in metropolitan areas and 54% in regional and remote areas. In regional and remote schools, leaders with over 10 years of experience were at least as common (28%) as in metropolitan schools (27%) in 2022. As schools in regional and remote areas tend to be smaller than their metropolitan counterparts (Lamb et al. 2014), they tend to have a higher leader to teacher ratio. This could potentially provide more opportunities for classroom teachers to transition to leadership positions in regional and remote schools.
For a more detailed analysis on leadership in schools refer to the section on School leadership.
Intentions to leave the profession prior to retirement increased for both the metropolitan teacher workforce and regional and remote teacher workforce from 2020 to 2022.
Between 2020 and 2022, the proportion intending to leave the profession in the regional and remote teacher workforce increased by 10 percentage points from 25% (2020) to 35% (2022). The increase is even more pronounced in major cities which saw a 14 percentage point increase (2020: 22%; 2022: 36%). In inner regional areas, the proportion of teacher workforce with intentions to leave the profession increased by 11 percentage points (2020: 24%, 2022: 35%), which is 3 percentage points higher than that of the outer regional areas with an increase of 8 percentage points (2020: 25%, 2022: 33%). Remote (2020: 28%, 2022: 38%) and regional areas (2020: 27%, 2022: 39%) experienced similar increases in the proportion of teacher workforce who intended to leave.
From 2020 to 2022, the proportion of the teacher workforce in regional and remote areas intending to stay in the profession until retirement decreased by 13 percentage points (2020: 41% to 2022: 28%). Similarly, the proportion of the teacher workforce in major cities intending to stay in the profession until retirement decreased from 42% in 2020 to 28% in 2022 (-14 percentage points).
In 2022, the proportions of teachers intending to stay also varied across SA4s where most schools in a geographic area were located. Teachers in inner regional areas (2022: 29%), major cities and outer regional areas (2022: 28% for both), were slightly more likely to report they intended to stay until retirement than teachers in very remote areas (2022: 27%) or remote areas (2022: 22%). One explanation is that it may reflect increased pressures on teachers in remote and very remote areas. In particular, the higher proportion of teachers working more than 50 hours per week in remote and very remote areas may explain why they reported the lowest rates for intending to stay in the profession through to retirement in 2022.
‘Workload and coping’ remains the top category of reasons for leaving for those in the regional and remote teacher workforce as well as teachers in major cities.
Since 2020, ‘workload and coping’ has remained the most common reason for intending to leave prior to retirement for all groups within the workforce, increasing from 88% citing this reason in the regional and remote teacher workforce in 2020, to 92% in 2021 and 2022. A similar trend was found for the teacher workforce located in major cities with 87% citing ‘workload and coping’ as the most common reason for intending to leave prior to retirement in 2020 increasing to 94% in 2022 (2021: 92%).
The trends for all reasons for leaving were the same for regional and remote teachers and metropolitan teachers. All reasons for leaving the profession were cited more often in 2022 compared to 2020, by teachers in both regional and remote areas and major cities. The only exception was the reason ‘taking a break from teaching’. The proportion of teachers who cited a break from teaching as a reason for leaving the profession decreased by 11 percentage points in major cities (2020: 34%, 2022: 23%) and 7 percentage points in regional and remote areas (2020: 30%, 2022: 23%).
Factors affecting teacher supply
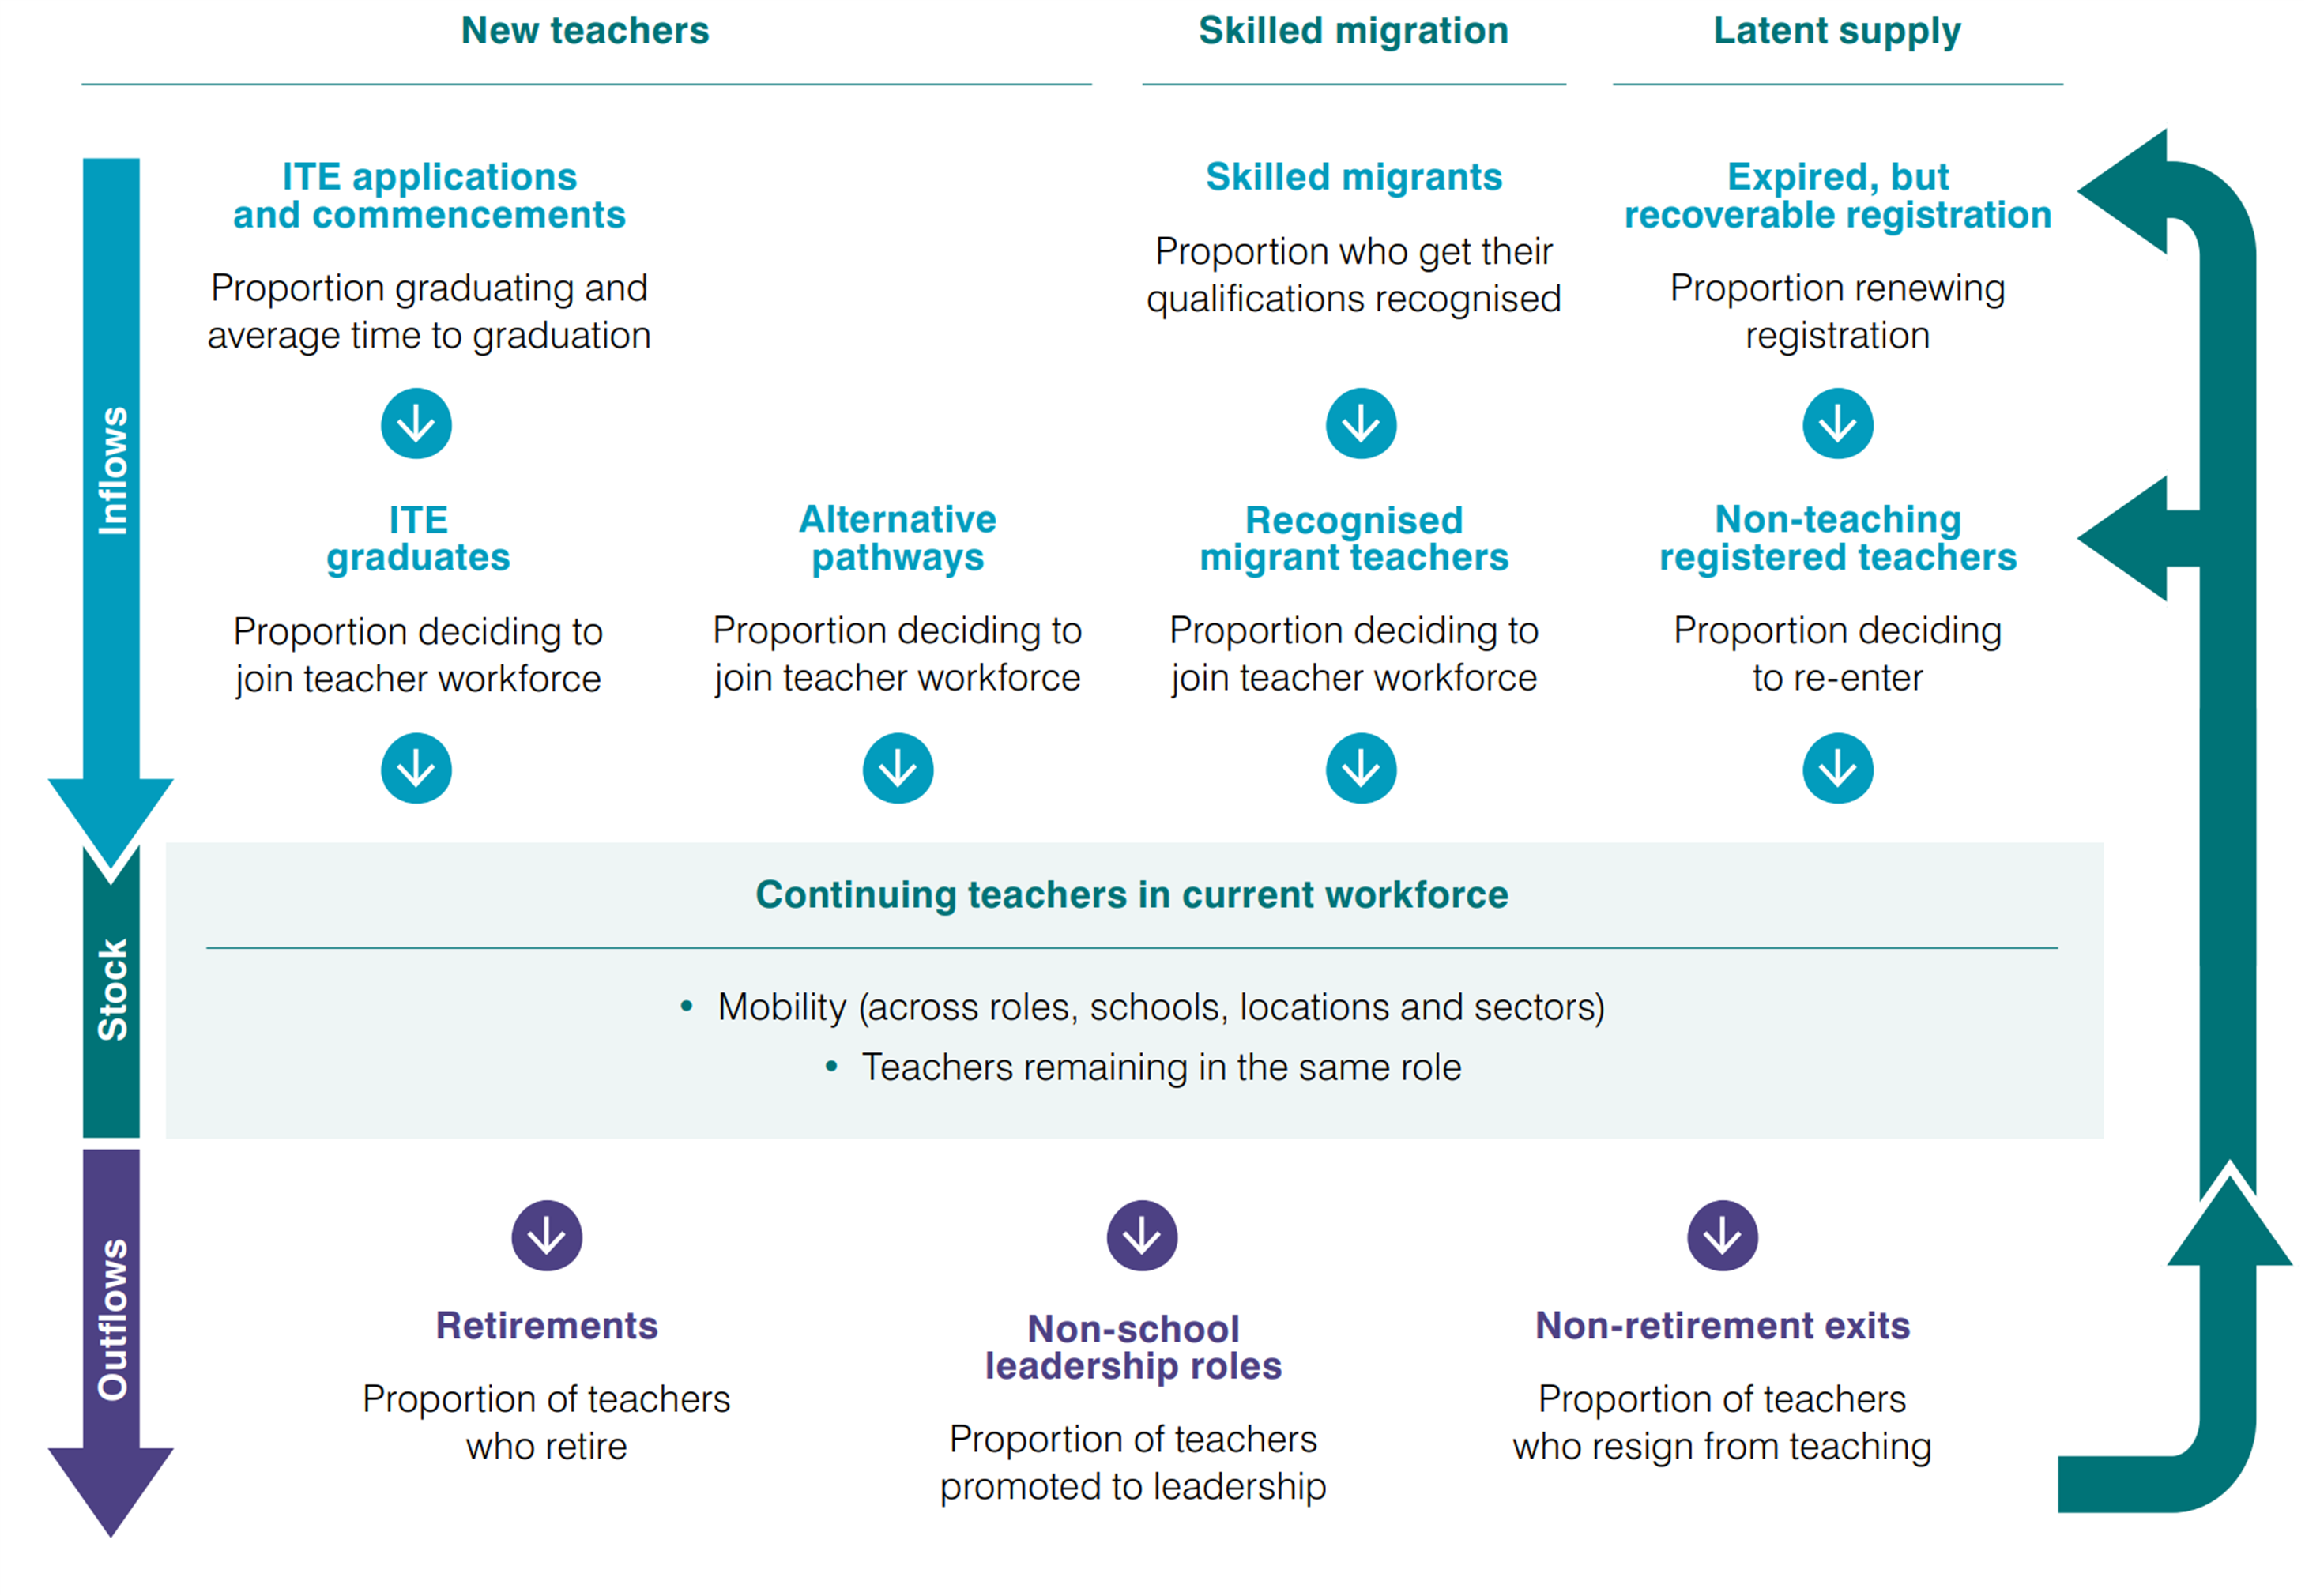
Describing the supply of teachers requires consideration of both the current teacher workforce pool, as well as the incoming and outgoing flows of the teacher workforce. Teacher supply is an outcome of the number of people in the workforce at present, the number and rate of entry of people entering the workforce (inflows), and the number exiting the workforce (outflows).
An understanding of teacher supply requires consideration of multiple pathways of entry and exit (see Figure 11). In this publication, teacher supply is examined in the context of the existing teacher workforce pool (continuing teachers in current workforce) at points in time and through considering trends in the factors that impacting supply in isolation. However, the quantum of work provided by any teacher may change over time, with those currently in the pool potentially supplying more or fewer teaching hours into the future. To fully understand supply requires understanding complexities such as promotions and position changes, the aging workforce, the amount of face-to-face teaching performed and subjects taught, and the equivalent full-time load of staff. These factors would also be expected to co-occur. For instance, as teachers age, they may transition to casual/relief-teaching or part-time employment prior to retirement, and these position changes will typically reduce the equivalent full-time supply provided by this teacher. Under actions 25 and 26 of the National Teacher Workforce Action Plan, modelling of the trends and correlations between these factors will be undertaken using the longitudinal data to allow a nuanced and accurate prediction of changes and flows and critical factors impacting supply.
Outflows
The size of the available teacher workforce is determined by both inflows (through ITE, migration and other pathways) and outflows, and the success of retention strategies. For example, some individuals will leave a profession due to retirement, and this can be forecast by analysing the age distribution. Others will leave prior to retirement, and this is where understanding career intentions and actual patterns of retention becomes critical.
Intentions to leave the profession
Understanding the intentions of the teacher workforce to stay in the profession until retirement provides important insights into their perceptions of the long-term sustainability of their own personal teaching career. Analysis of their reasons for why they intend to leave also highlights factors which could be addressed to increase retention.
In 2020, intentions to leave the profession prior to retirement decreased to the lowest recorded level (22%), however in 2022 intentions to leave increased to their highest recorded level in the ATWD (34%).
The COVID-19 pandemic brought unprecedented challenges and disruptions to the teacher workforce. Amidst these changes, intentions to leave the profession prior to retirement dropped (2019: 27%; 2020: 22%), possibly due to the uncertainties arising from the pandemic. However, the intentions of teachers to leave the profession have increased across the workforce since 2020, with more intending to leave prior to retirement in 2022 (34%). This highlights that career intentions are subject to pressures within the teacher workforce, but also need to be considered in the context of macro-economic and broader societal events.
Career intentions are generally consistent across groups, however, there are some small differences in line with seniority. Those in senior school leadership positions have consistently been less likely to intend to leave the profession before retirement (see Table 8). This may partly reflect job security and pay. When those who intend to remain in the profession until retirement were asked why, school leaders, and especially more senior leaders, were more likely to indicate that being well paid was a reason they stayed (senior leaders: 19%, middle leaders: 16%; classroom teachers: 15% in 2022).
Table 8: Proportion intending to leave before retirement over time by workforce segments
| Workforce segment | 2019 | 2020 | 2021 | 2022 |
|---|---|---|---|---|
| Teacher workforce | 27% | 22% | 25% | 34% |
| Classroom teachers | 29% | 24% | 28% | 36% |
| Middle leaders | 26% | 21% | 23% | 33% |
| Senior leaders | 21% | 17% | 19% | 25% |
| Casual/relief teachers | 23% | 18% | 19% | 25% |
| Regional/remote teacher workforce | 28% | 25% | 26% | 35% |
| Metropolitan teacher workforce | 28% | 22% | 26% | 36% |
| Migrant teachers | NR | 18% | 19% | 28% |
| Teachers with Australian ITE | 27% | 23% | 26% | 35%/td> |
Younger teachers are more likely to have uncertain career intentions.
A person having one career, for their whole working life, is increasingly rare (ABS 2022). The younger a teacher is, the more likely they are to have more than one career following teaching. There is also a larger number of years that people have to assess their intentions over.
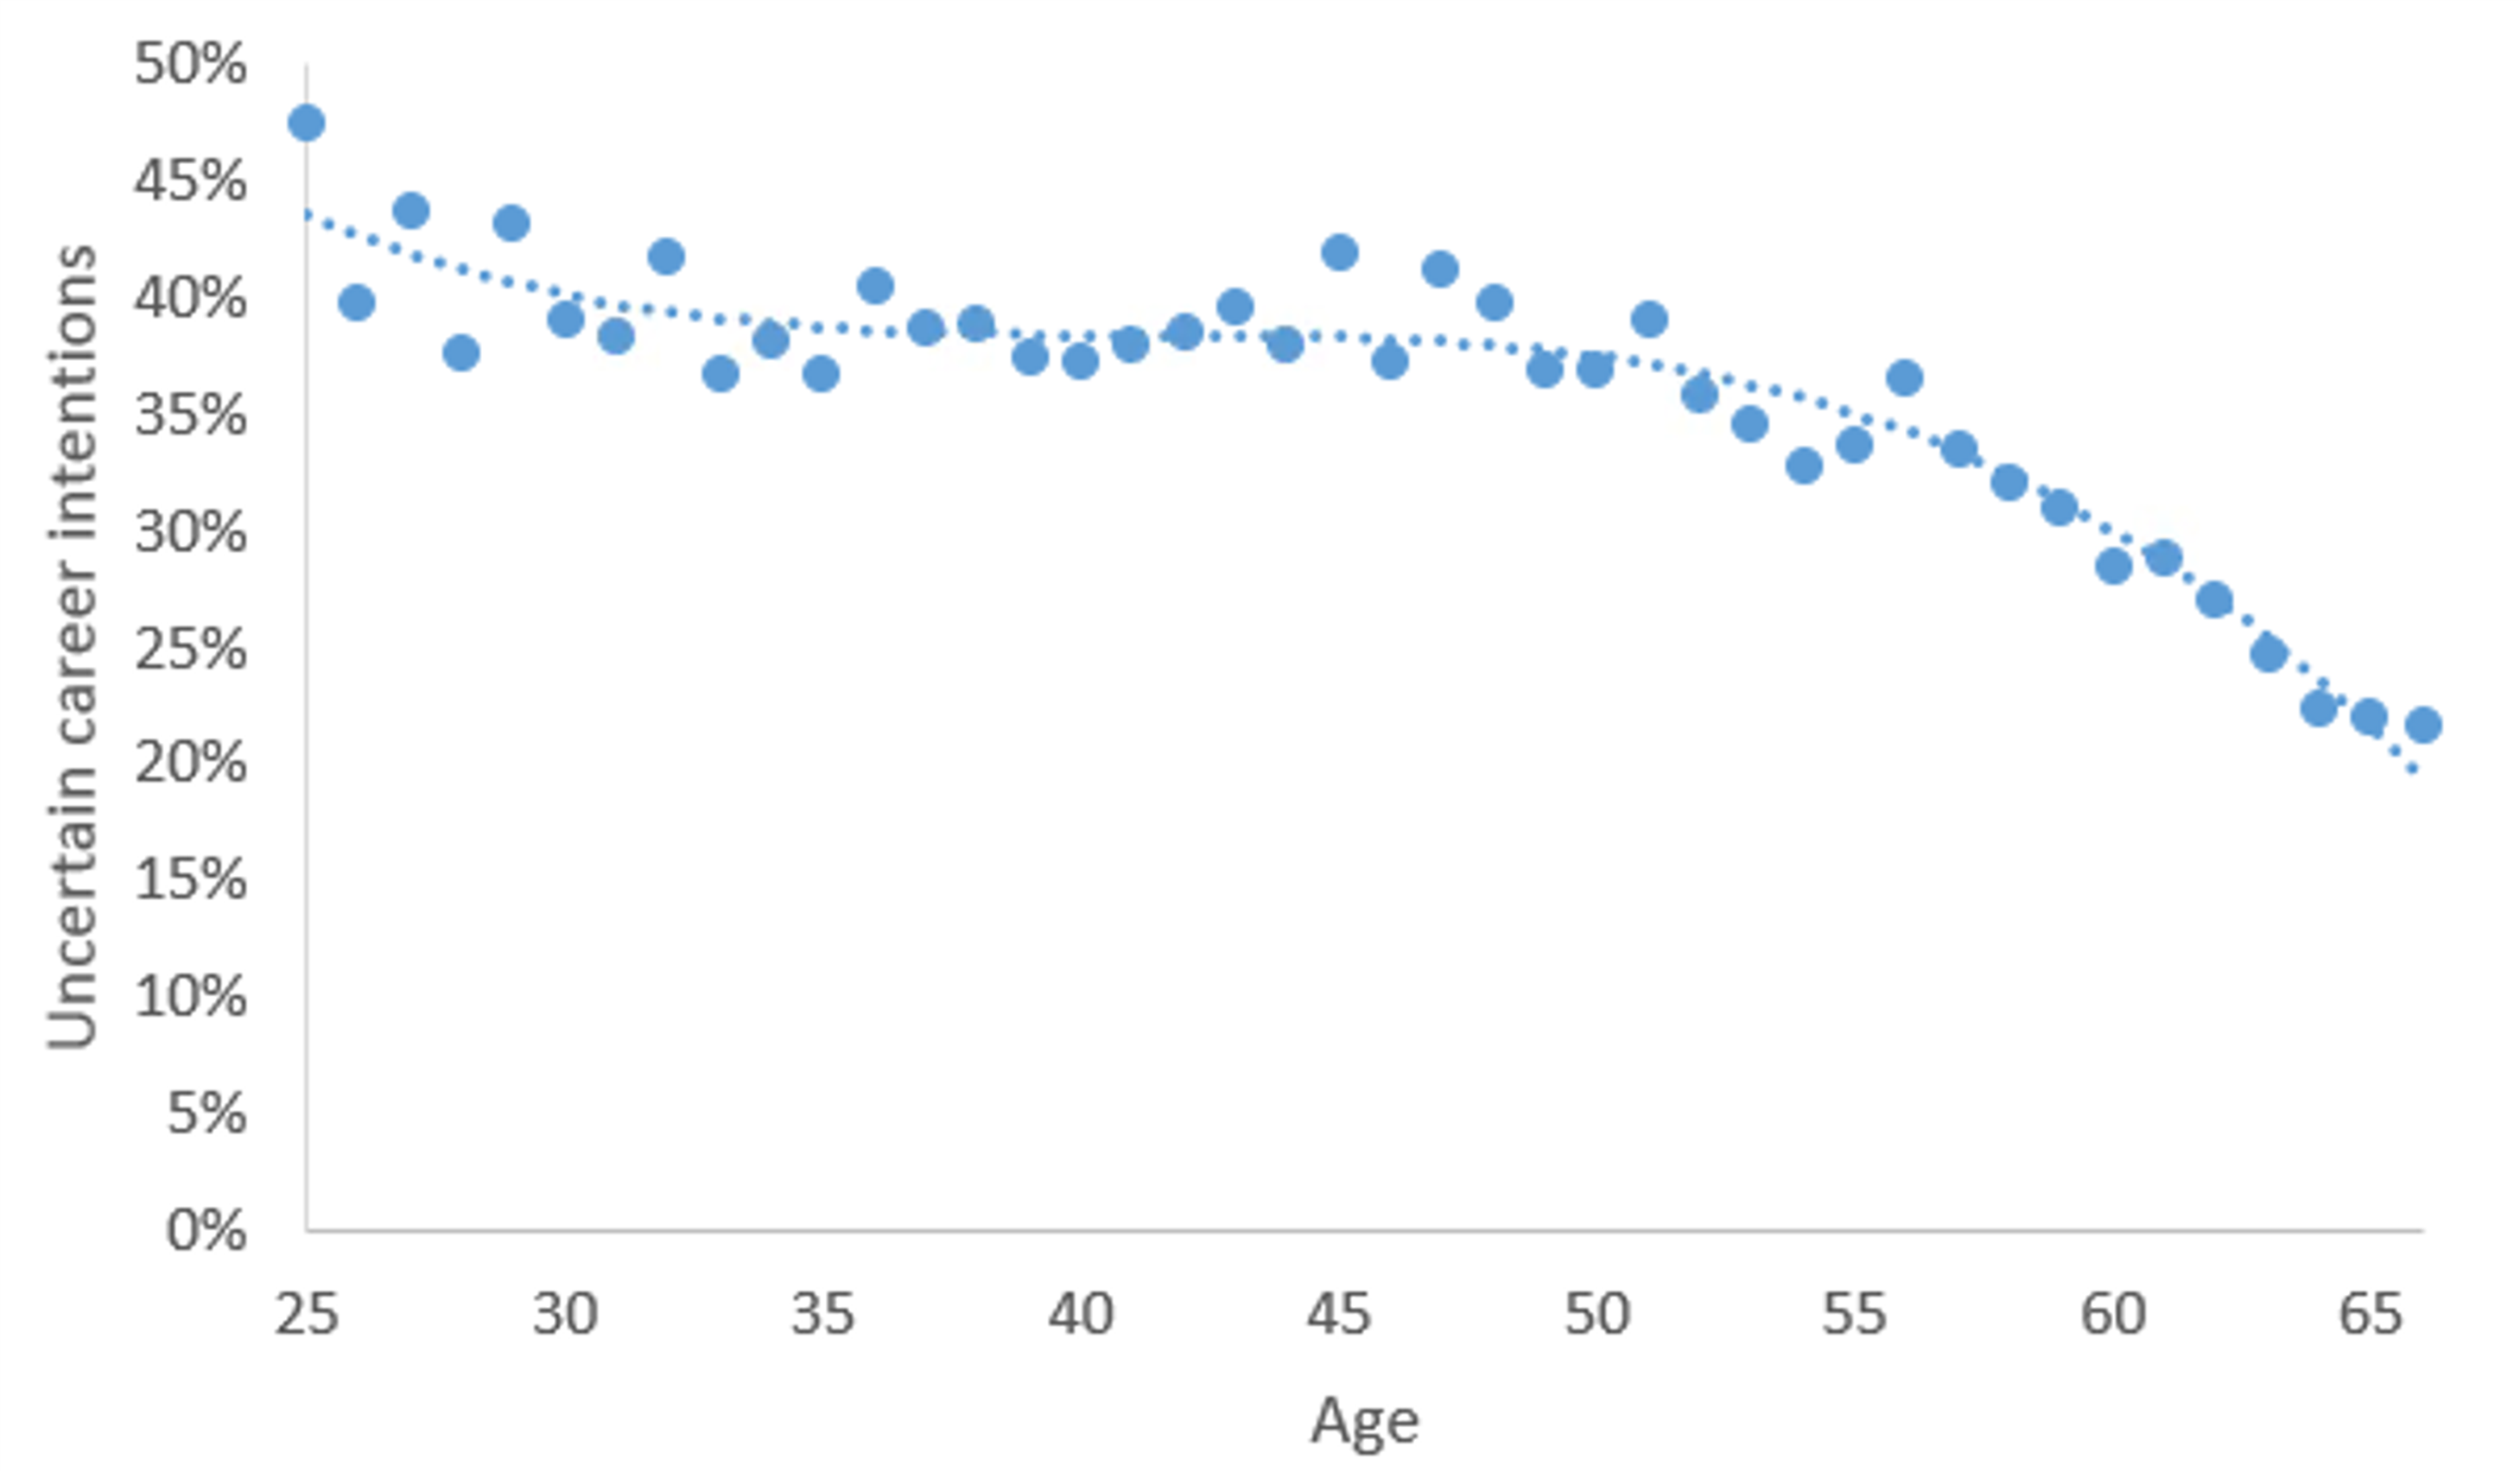
In 2020, younger teachers were more likely to be uncertain whether they intended to remain in the profession until retirement or not (see Figure 12). The proportions that were unsure as to whether they would leave before retirement, or remain, were:
- 48% of 25 year olds
- 39% of 30 year olds
- 37% of 40 year olds
- 37% of 50 year olds
- 29% of 60 year olds
- 22% of 65 year olds
Note. Trend-line is a cubic line of best fit
When do people plan to leave
The three broad categories of career intentions, ‘leave before retirement’, ‘remain until retirement’, and ‘unsure’ are best understood by expanding the ‘leave before retirement’ category based on the information about how long teachers intend to remain before leaving into more detailed categories (see Table 9).
Increases in intentions to leave the profession before retirement have largely been for those who intend to leave in the short term, immediately, and in the medium term rather than in an uncertain period of time.
From 2018 to 2021, the least common intention category was those intending to leave immediately (in one year or less) (range: 1.9-4.3%). This group grew by 59%, from 2.7% in 2021 to 4.3% in 2022. The number of teachers intending to leave after a short length of time (2-4 years) (68% growth), a medium amount of time (5-9 years) (42% growth) and an uncertain amount of time (16% growth) also grew from 2021 to 2022.
There were large increases in the proportion of the teacher workforce intending to leave within 10 years from 2020 to 2022, such that the levels reached in 2022 were above pre-pandemic levels (2019: 16%, 2022: 21%).
Besides the 9 percentage point increase in the total number of teachers intending to leave the profession before retirement, it is notable that every subgroup of those intending to leave increased from 2021 to 2022. This is seen most in those who are wishing to leave the profession in a short term (2021: 4.40%, 2022: 7.40%) and medium term (2021: 6.40%, 2022: 9.10%). A similar pattern can be seen over the period from 2020 to 2021, with the exception of a drop in those intending to remain for at least 10 years but still leave before retirement (2021: 39.7%, 2022: 30.20%).
Table 9: Proportion of teacher workforce career intentions, by year
| Broad intention | Proximity of departure | Detailed information | 2018 | 2019 | 2020 | 2021 | 2022 |
|---|---|---|---|---|---|---|---|
| Leave | Uncertain | Leave before retirement, not sure when | 6.0% | 6.3% | 6.1% | 7.0% | 8.1% |
| Leave | Immediate | Leave in 1 year or less | 2.5% | 2.5% | 1.9% | 2.7% | 4.3% |
| Leave | Short-term | Leave in 2-4 years | 4.3% | 4.8% | 3.3% | 4.4% | 7.4% |
| Leave | Medium-term | Leave in 5-9 years | 7.7% | 8.4% | 5.3% | 6.4% | 9.1% |
| Leave | Long-term | Remain for at least 10 years, leave before retirement | 6.2% | 5.3% | 5.6% | 4.5% | 5.2% |
| Remain | Remain | Remain until retirement | 37.3% | 38.3% | 42.1% | 39.7% | 30.2% |
| Unsure | Unsure | Unsure of career intentions | 35.9% | 34.3% | 35.7% | 35.2% | 35.7% |
Uncertainty of career intentions
After age 30, the intentions of teachers to leave the profession before retirement get lower as they approach retirement age
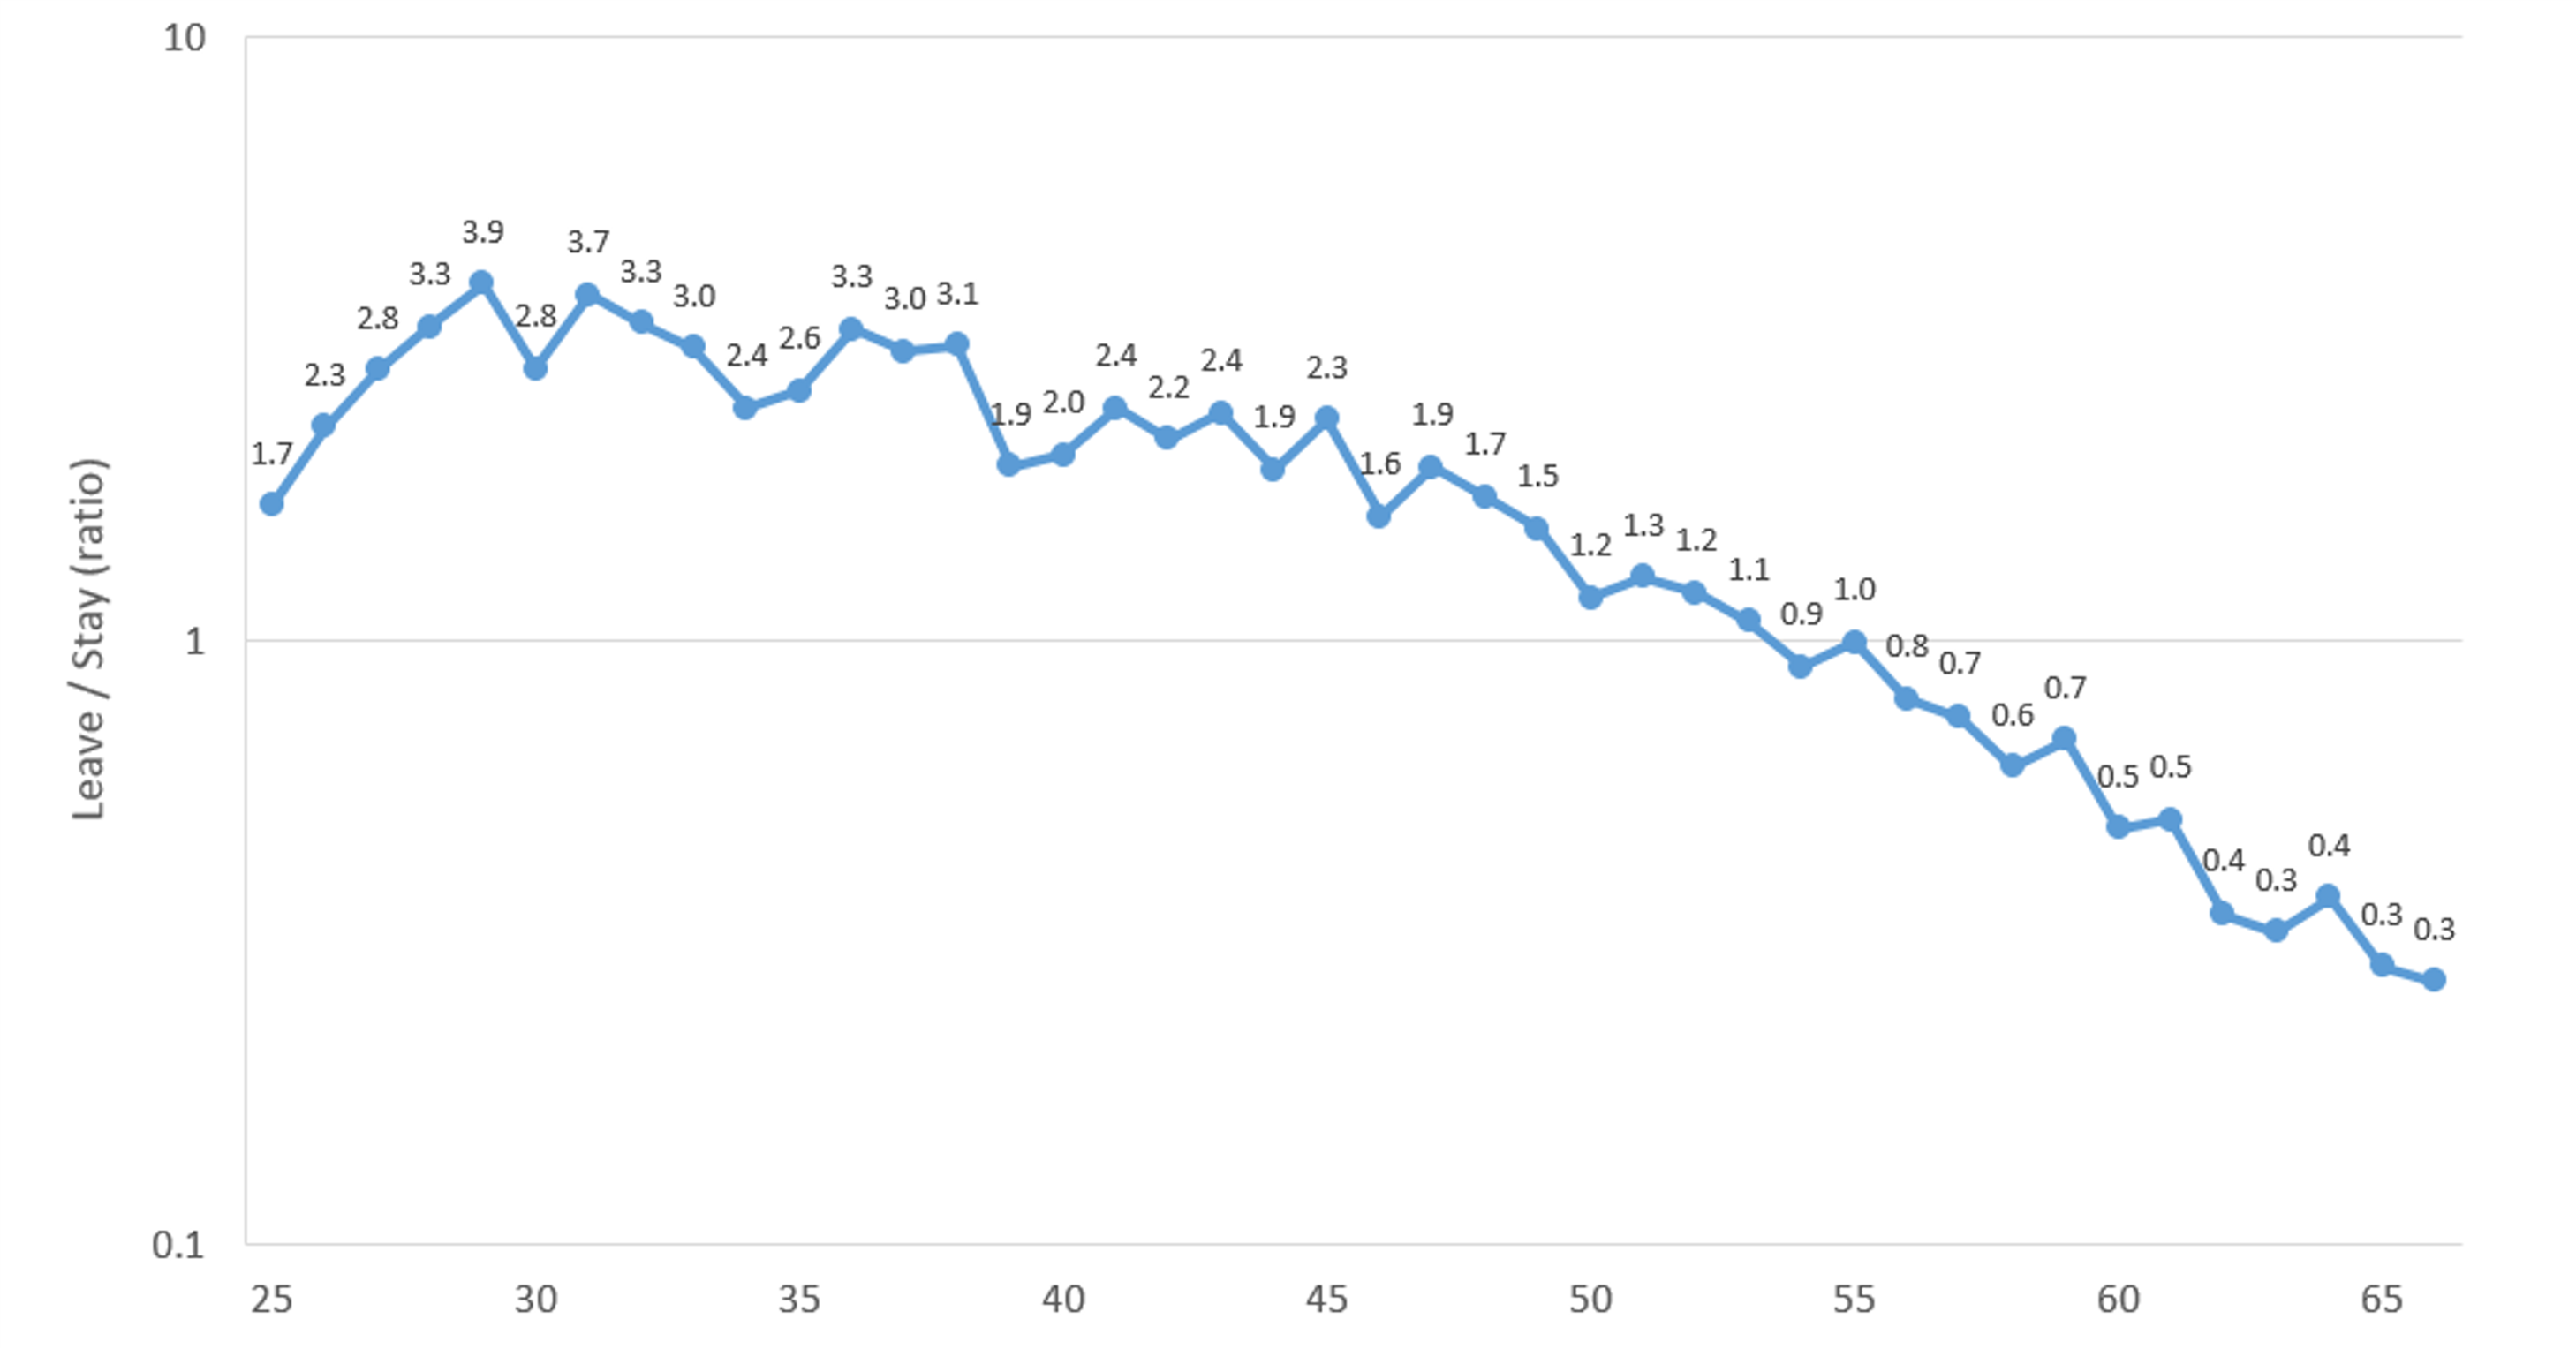
For those with clear career intentions, an analysis of intentions by age indicated that the likelihood of intending to leave the profession peaks at age 29, at 3.9 times more likely to indicate leave before retirement than stay until retirement (see Figure 13). Notably, 25 to 29 year olds are most uncertain about their career intentions. The likelihood of intending to leave remains higher than intending to stay until somewhere between ages 53 and 55. At age 66, the teacher workforce is 3.7 times more likely to stay in the profession until retirement. In some ways this is not surprising, as younger teachers intending to stay until retirement are committing for a longer period of time.
Food for thought
Q. Why are casual/relief teachers more likely to plan to stay until retirement than classroom teachers?
The relationship of age to career intentions may account for some of the differences in career intentions across groups. Casual /relief teachers are relatively older than classroom teachers. In 2020, 34% were over 60 years of age, compared to just 14% of classroom teachers. Older teachers are more likely to intend to remain in the profession until retirement. In fact, for each year over 60 years of age, the workforce is at least twice as likely to indicate that they will stay in the profession until retirement than they are to plan to leave before retirement. However, there are other factors which are also likely to be at play, such as a lower unpaid workload.
One of the challenges for understanding the teacher workforce is understanding when a difference between workforce segments or teachers in different roles and positions is likely to be related to their experiences of work, whereas other times they may be due to differences in the characteristics of the workforce in these segments, roles or positions.
Attrition
The ATWD captures attrition in a number of ways. These include examining the number of ITE graduates from each cohort who remain registered at future points in time, the proportion of registered teachers who are not registered in any state or territory the following year, data collected from non-deployed respondents to the ATWD Teacher Survey on when they left the profession, and examining those with survey responses in multiple years who move from the teacher workforce to non-deployed
Using this data, attrition has been analysed through examining the proportion of each cohort of Australian-trained domestic ITE graduates that remained registered in 2020. The ATWD does not capture similar data for overseas-trained ITE graduates.
For each since ITE graduation, the proportion of the cohort who has discontinued registration increases by 1.3 percentage points.
Analysis in the ATWD Key Metrics Dashboard has found that 5.25% of individuals who graduated ITE in 2019 did not hold full or provisional registration in 2020. With each subsequent year in the profession, the percentage of ITE graduates who remained registered declined by an average of 1.28 percentage points per year (see Figure 14). This data is based on pre-Covid experiences and post-Covid retention may look different. If this trend holds for future years of registration with the same cohorts, and holds with earlier ITE cohorts, it indicates that a small number of teachers exit the profession each year.
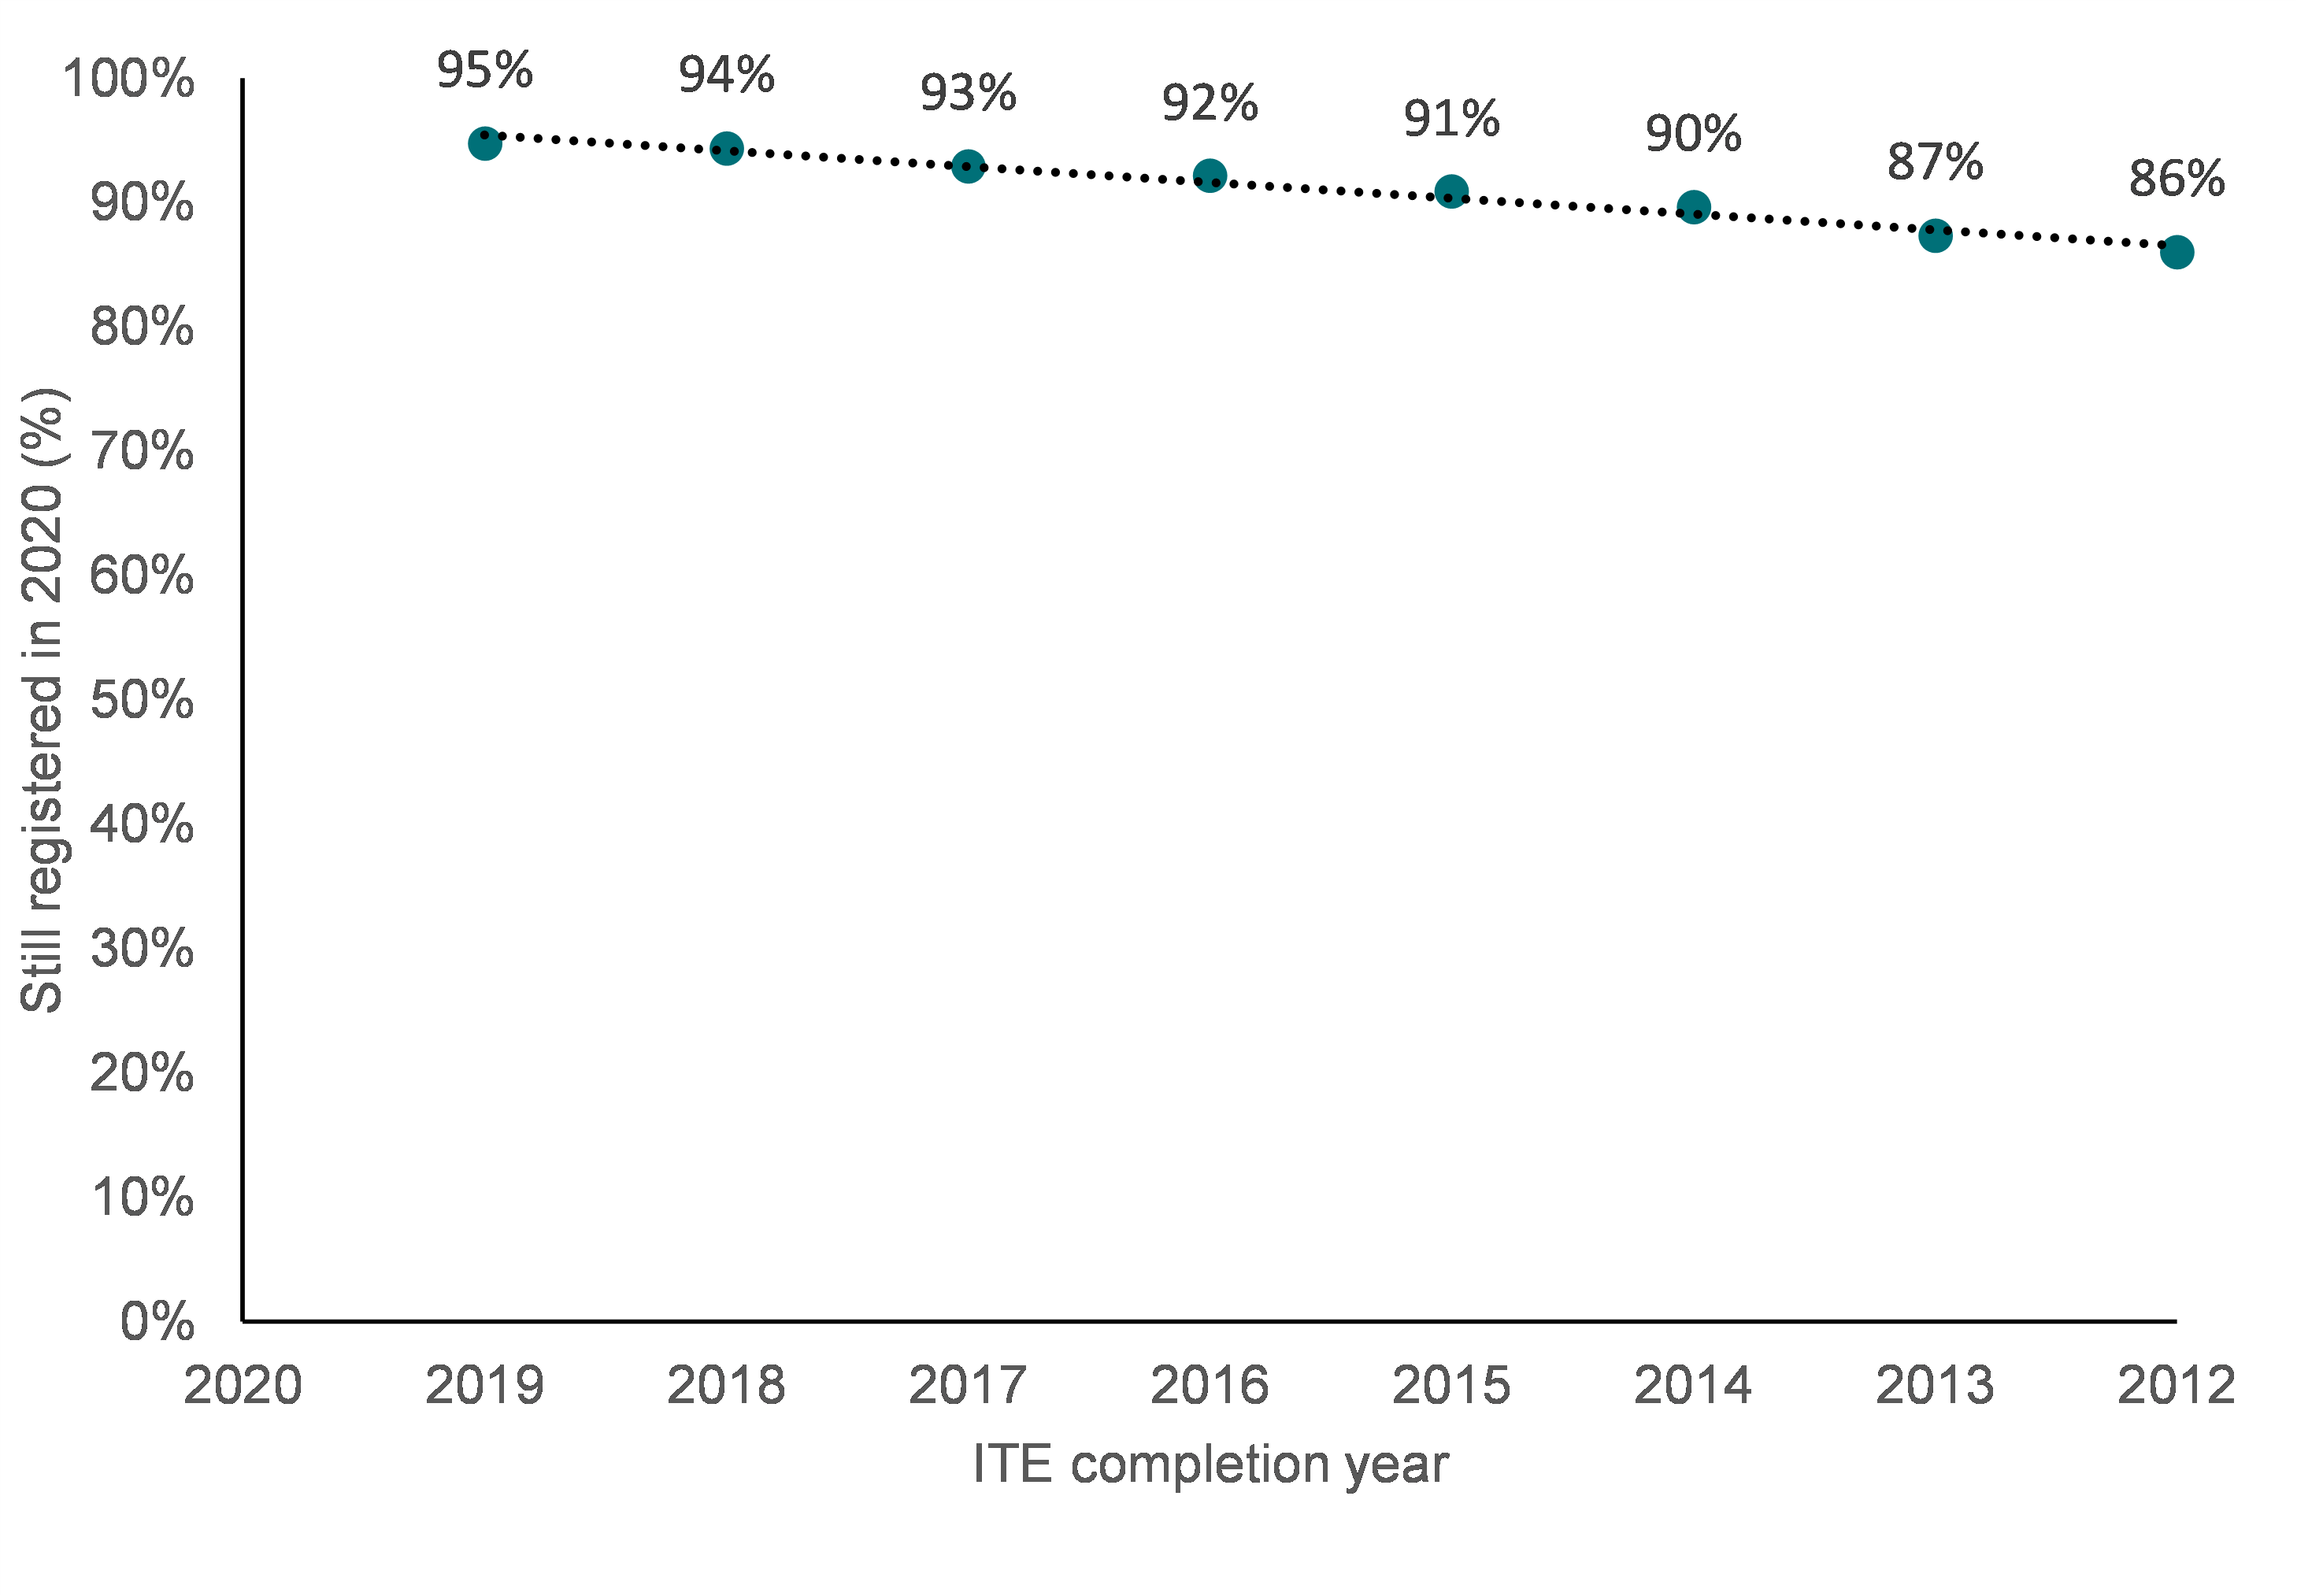
For the ITE cohort who would have been at the end of their five-year early-career period in 2020 (2015 graduates), 91% remained registered. Although the workforce pathways of 2015 graduates over time are not known, the cross-sections of these graduating cohorts, taken together, suggest 5% do not enter the workforce. Of those who entered the profession, 96% were still registered.
Actual rates of attrition may be higher than the rates of discontinuation of registration. Teachers may opt to maintain their registration, despite no longer working in schools or early childhood services. However, for early career teachers this choice to maintain registration while no longer working appears unlikely, as they appear to maintain registration for a shorter period than others in the non-deployed teacher pool for 2022.
Intentions to leave the profession within 1 year are generally aligned with annual registration discontinuation rates
The percentage of the teacher workforce that intended to leave the profession in one year or less in 2019, and therefore would not be expected to part of the 2020 teacher workforce if their intentions were accurate, was 2.5%. These and other attrition intentions were somewhat higher than the average rate of registration discontinuation up to 2020, at 1.28 percentage points.
This relatively small difference suggests intentions to leave and registration discontinuation are broadly comparable. As teachers may maintain their registration for a variety of reasons after having otherwise left the workforce, including carer responsibilities and during career changes, the rate of registration discontinuation is a lower limit estimate for attrition. At the same time, the uncertainty of intentions data means this data likely over-estimates behaviour, which can serve as an upper limit for attrition. Actual rates of attrition are likely to fall between the two limits, at around 2% per annum. It is likely that intentions to leave within one year are a more accurate measure of actual behaviour than longer-term intentions. Due to the longitudinal nature of the ATWD, the relationship between longer-term intentions and actual behaviour can be tested over time.
Food for thought
Q. Do half of all teachers leave within the first 5 years?
A wide range of estimates for early career teacher attrition have been produced in Australia, with some indicating that up to 50% of teachers leave in the first five years. The analysis in this report shows that 1.25% percent of teachers who registered the year after graduating from ITE discontinue registration each year. This means that attrition over the first five years is closer to 5% than 50%.
Retirement
Retirement occurs at highly variable ages which makes understanding attrition due to retirement challenging. Although the official retirement age is 67, the average age people retired in 2019 was 55.4 years (ABS 2020). The average age of retirement corresponds to when the teacher workforce becomes more likely to intend to remain in the profession until retirement, rather than leave before retirement. As a result, it is likely that workforce exits after 55 are highly likely to be retirements, with likelihood increasing with age.
In 2022, those who had left the profession were asked when they had ceased teaching or leadership, and the number of years since they started teaching were examined. Approximately half of those who had left did so in either 2020, 2021 or 2022 (49%), while many registered teachers had left more than 10 years ago, highlighting that data on more recent exits is likely to be more complete.
Attrition, as evidenced by additional analysis of 2022 departee’s experience levels, is largely uniformly distributed relative to the teacher workforce, at least up to 30-39 years of experience. The odds of teachers at each experience level, from 1-5 years of experience to 30-39 years of experience, departing the profession range from 16% lower odds to 32% lower odds, respectively.
However, a greater proportion of departees than would be expected, based on the teacher workforce experience distribution, were among those with 40 or more years of experience (58 greater odds). A similar pattern was observed for 2021 departees. Not surprisingly, teachers with over 40 years of experience are disproportionately likely to leave the profession.
| Years commenced since teaching | ||||||
|---|---|---|---|---|---|---|
| 1-5 | 6-9 | 10-19 | 20-29 | 30-39 | 40+ | |
| Typical ages | Under 30 | 31-35 | 36-48 | 49-55 | 56-64 | Over 65 |
| 2022 departees | 16% | 17% | 29% | 15% | 9% | 16% |
| 2021 departees | 9% | 12% | 29% | 18% | 15% | 9% |
| 2022 teacher workforce | 21% | 15% | 28% | 17% | 12% | 8% |
Retention
Teachers intending to leave the profession reported the reasons that are motivating them and could report more than one reason. These reasons provide insights into the areas best targeted to change teachers’ career intentions.
The most cited categories of reasons for those intending to leave have consistently been ‘workload and coping’, ‘reward and recognition’ and ‘administrative workload’.
In 2022, the three most cited categories of reasons for intending to leave the teacher workforce prior to retirement were:
- Workload and coping: 92%
- Recognition and reward: 76%
- Administrative workload: 67%
The rankings of these reasons were consistent across classroom teachers, middle leaders, and senior leaders. The top two listed factors increased in frequency from 2020 to 2022 (‘workload and coping’ +8 percentage points; ‘recognition and reward’: +11 percentage points). The top two reasons cited were also at rates just higher than their pre-pandemic levels (highest levels pre-pandemic were in 2019; ‘workload and coping’ +4 percentage points; ‘recognition and reward’: +5 percentage points). The ‘classroom factors’, as the fourth most frequently reason, were cited 8 percentage points more often (2019: 55%, 2022: 63%).
The increase for ‘classroom factors’ from 2019 to 2022 was not confined to classroom teachers (+6 percentage points) and also affected middle and senior leaders (+8 and +10 percentage points, respectively). This means that across schools, issues of ‘insufficient support staff’, ‘class sizes being too large’, and ‘facing challenges with student behaviour management’ have increased.
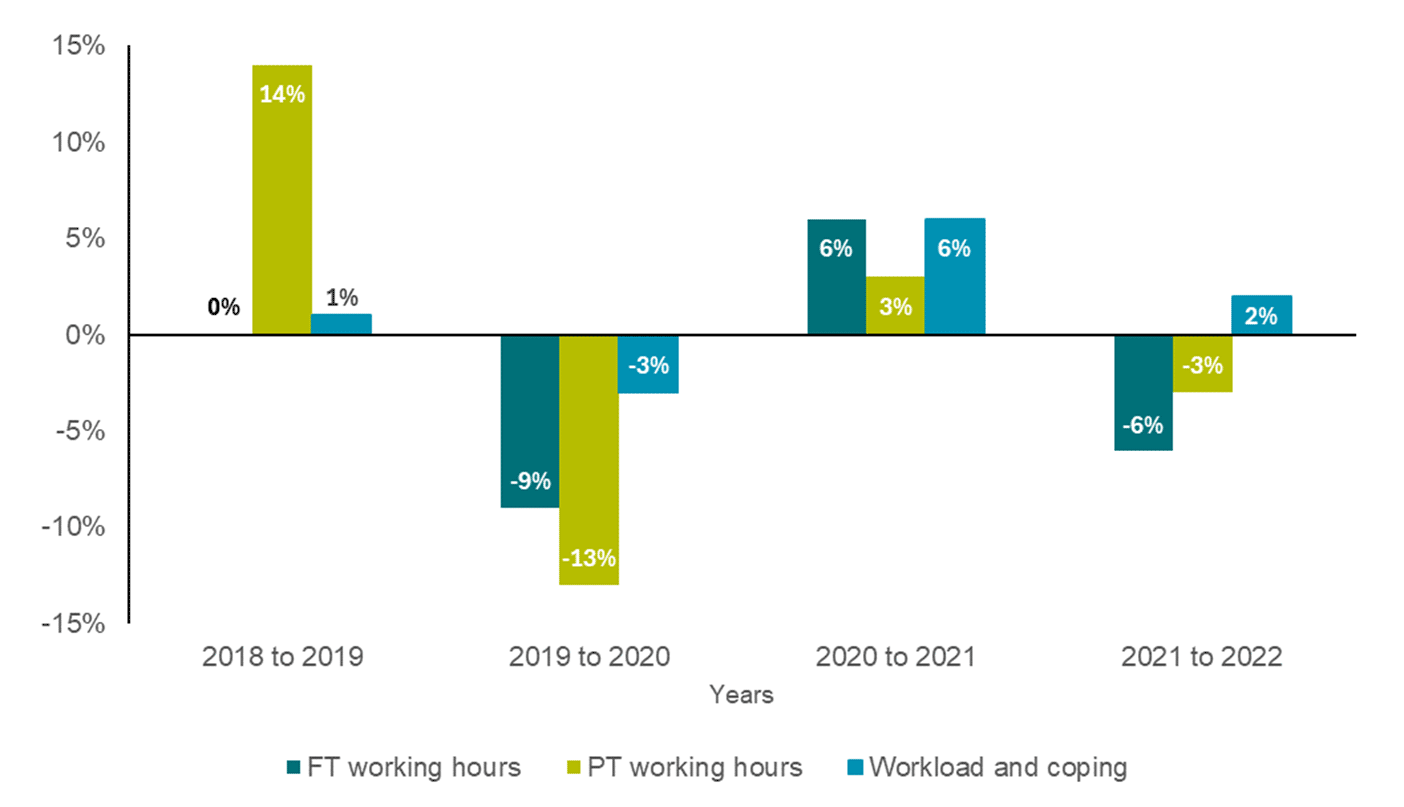
The high level of challenge with ‘workload and coping’ has persisted and even increased over time, during a period where working hours in excess of paid hours for the full- and part-time working week have decreased slightly. When the change is examined annually (see Figure 15) from 2018 through to 2021, as working hours increased or decreased, so too did the selection of ‘workload and coping’ reasons. Up to, and through the impacts of COVID-19, there may have been a relationship between working hours and perceptions of a heavy workload. However, from 2021 to 2022, a period where working hours decreased , the perceptions of a heavy workload increased slightly.
As part of the National Teacher Workforce Action Plan, measures of teacher wellbeing are being incorporated into the ATWD Teacher Survey, which will allow the complexities of this relationship to be understood.
School culture is a reason that leaders stay, but classroom teachers leave
School culture was the sixth most frequently provided reason for intending to leave the teacher workforce in 2022. School culture was more commonly cited as a reason by classroom teachers intending to leave the profession (50%), than by middle leaders (47%) or senior leaders (43%). The opposite was true when reasons for remaining in the profession were examined. School culture was a more critical factor for senior leaders choosing to stay in the profession (60%), than for middle leaders (50%) or classroom teachers (47%).
Pay is rarely a reason that classroom teachers stay in the profession.
Across positions, the differences in the reasons teachers choose to remain in the profession also provide information relevant to understanding attrition. Classroom teachers in schools rarely indicated that they stayed because they were well paid relative to their skills and experience (15%). Although still not a common reason, it was slightly more commonly cited by middle leaders (16%) and senior leaders (19%).
Consistent with CRTs having a smaller proportion of total working hours as unpaid overtime, CRTs were most likely to indicate that they remained because they were well paid (25%).
Despite high intentions to leave the profession, the fact that many teachers have not yet made up their mind means there is large scope for retention initiatives to make an impact.
Understanding the teacher workforce in the context of modern careers can be further achieved by considering the longevity of careers to date, the career plans of teachers, and the potential available if those who were uncertain decided to stay in the profession until retirement (see Figure 16). This analysis does not consider complexities such as whether a teacher is likely to be working full-time or part-time across their years intending to remain, and their potential years remaining.
This analysis assumes an average potential career length of 44 years, based on the average career lengths of the oldest cohorts. The average proportion of potential career length that is likely to have been ‘lost’ is a product of:
- How far before retirement teachers plan to leave the profession
- The age at which teachers typically entered the profession
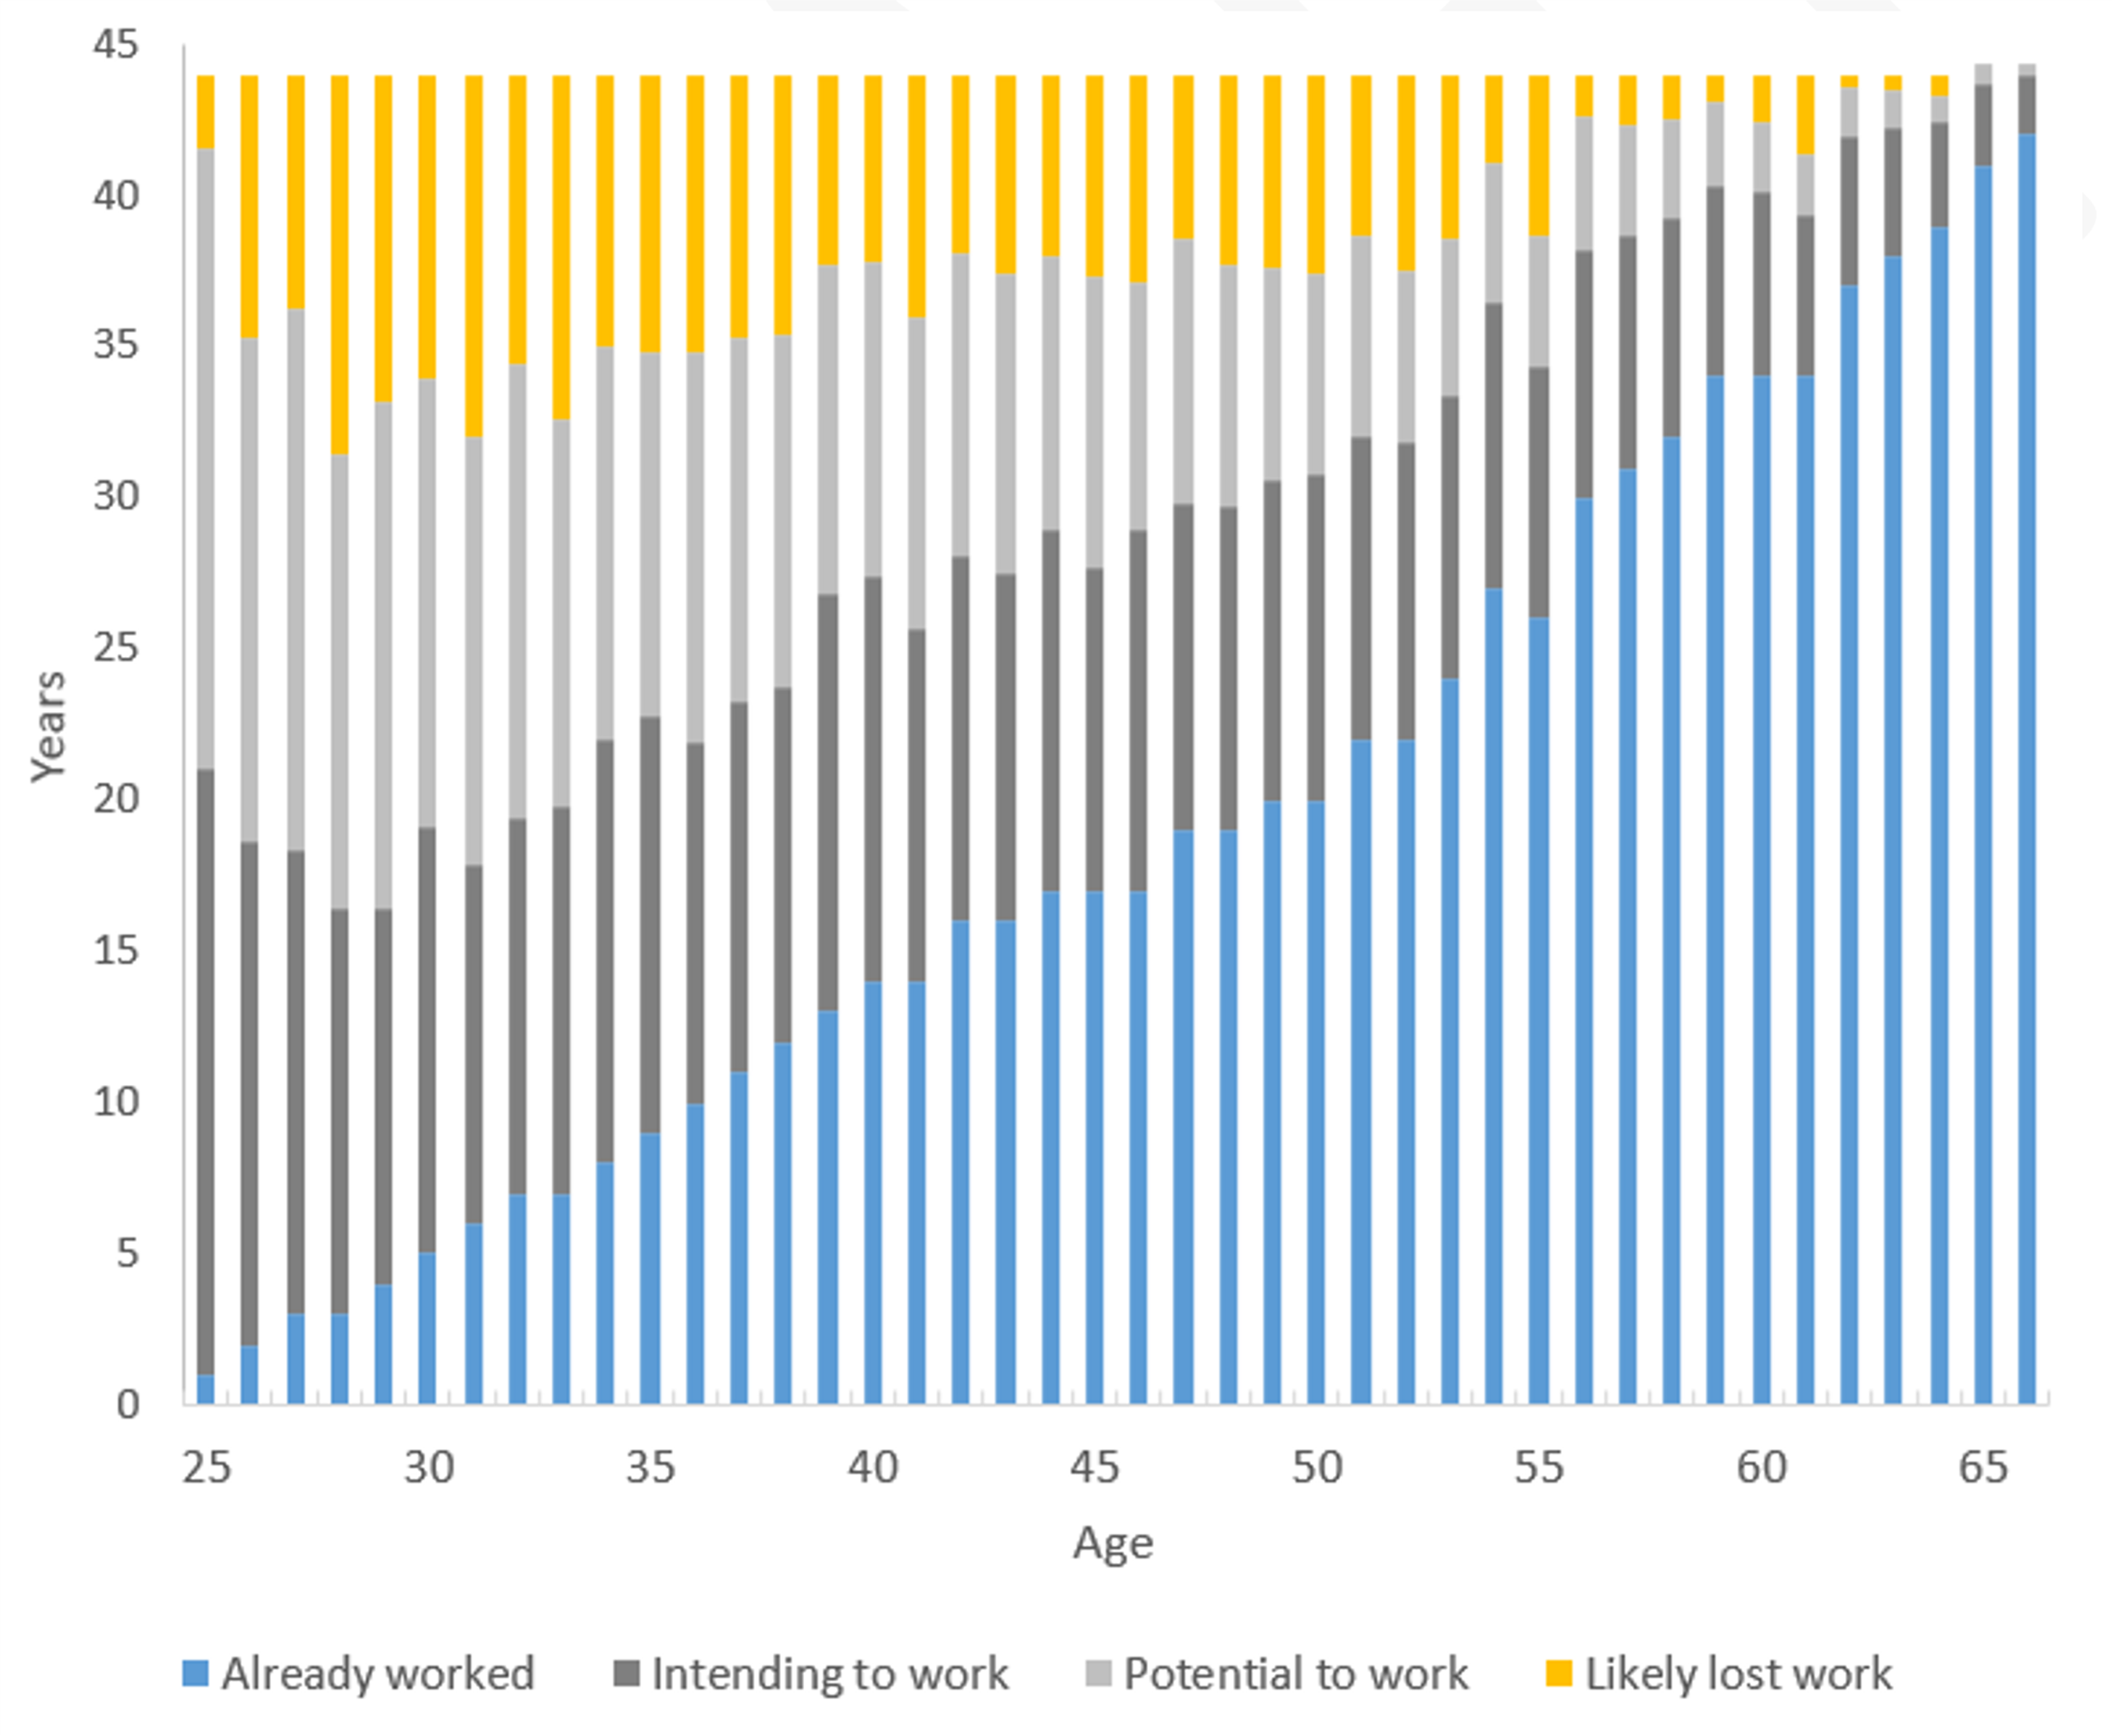
A major factor in the pattern seen above is the high uncertainty of career plans among younger teachers. From ages 25 to 30, the number of teaching career years that are likely lost due to intentions to leave the profession increase rapidly. This coincides with reduced uncertainty of intentions, and increased intention not to remain in the profession up until retirement over this period. Total career length expectations (years already worked plus years intending to work or remain) also decrease heavily from 25 to 30.
The potential number of working years indicates the number of years teachers who were unsure about their intentions could remain in the profession for prior to retirement, assuming that they decided to do so. This figure is highest when teachers are younger (25-30) and more uncertain, which currently co-occur. Teachers at each of these ages are all early career teachers. To maximise this uncertainty into potential work and teaching, it is important that early career teachers, regardless of the age they enter the profession, transition into teaching well. However, at the same time there have been falling rates of early career teachers reporting receiving induction support. The weakening of induction could become a critical workforce issue in the future if these younger cohorts do not choose to remain in the workforce for reasons linked to this.
- Where no source is noted, the data is available in the ATWD Key Metrics Dashboard.
- As this data is based on survey responses, and weighting of the sample to the population has not yet been performed, caution should be taken before combining the workforce structure with the calculated size of the registered teacher workforce.
- In 2018, NSW, NT and SA participated in the ATWD Survey. In 2019, NSW, NT, QLD, SA and VIC participated in the ATWD Survey.
- It is indicated when an analysis is not available elsewhere.
- Western Australia will be able to supply regulatory authority data from 2023 onwards.
- These teachers typically do not have completed ITE qualifications.
- This category combines those with limited registration or working under permission to teach arrangements, in some jurisdictions these individuals would be considered a registered teacher.
- The ATWD reports on all registered teachers deployed across schools and early learning centres, including those who are working as casual/relief teachers (CRTs), and those who are not currently working as teachers. As a result, the number of registered teachers reported in the ATWD is higher than the head count of teachers in schools reported in the ABS Schools. ABS Schools data does not include casual/relief teachers and only includes teachers in primary and secondary schools.
- Does not include WA, where only the total number of registrations is known.
- Average of 2.04 registrations each.
- This calculation is described on the reverse side of the ATWD Key Metrics Dashboard tile ‘Number of registered teachers, 2022’.
- This category combines those with limited registration or working under permission to teach arrangements, in some jurisdictions these individuals would be considered a registered teacher.
- Data from WA is not available for registration types.
- Differs to sum of individual roles due to rounding.
- 95% in 2019
- 2021: 22%
- Primary schools – 2020: 41%; 2022: 42%, secondary schools – 2020: 32%; 2022: 33%
- 2019: 16%
- 24% to 32% per year are currently unable to be classified. This is expected to fall over time.
- Although the teachers with a known location are a little less likely to be in major cities than the population, this is likely to be due to the schools which were not able to be classified into a remoteness area, rather than the over representation of teachers from regional or remote areas among respondents.
- Early career teachers are in their first 0–5 years.
- This change coincides with standardisation of the methodology for collecting contract hours information across all jurisdictions to ensure ease of understanding and national consistency. This methodological improvement may account for some of the longitudinal pattern.
- 38 hours per week, although most teaching contracts specify only a number of face-to-face hours.
- This exceeds the enterprise bargaining agreements in all states and territories.
- Teacher workforce: 3 to 8 percentage points lower; Classroom teachers: 2 to 7 percentage points lower.
- Leadership roles such as department heads and assistant principals.
- Such as principals, deputy principals and service directors.
- 2021 and 2022 data unavailable for senior leaders reporting their main role as a teacher with leadership responsibilities.
- -2.8 average hours
- -4.0 average hours
- Comprising those with 10-19 and 20-29 years of experience.
- Leaders in regional and remote areas tend to have a shorter tenure, based on 10 years experience: 32%, overall: 35%
- Employed on an ongoing or fixed-term contract, and not as a casual/relief teacher or CRTs.
- 2019: 11%, 2020: 11%, 2021: 10%, 2022: 11%
- At Australian Bureau of Statistics Statistical Area Level 4 (SA4s); when data on SA4s is reported from the Data Explorer, the remoteness level of the SA4 corresponds to the average remoteness of schools in that area, and the number reported is the average of SA4s with the same remoteness.
- These are the largest sub-State regions in the Main Structure of the Australian Statistical Geography Standard, comprising a minimum of 100,000 persons with larger populations (300,000 - 500,000) in metropolitan areas. The resulting labour markets are geographic regions, which reflect the highest degree of interconnectivity between the labour supply and demand.
- This is also expected to reflect locations of early learning centres.
- This is also expected to reflect locations of early learning centres.
- A teacher is deemed out-of-field if they are not qualified to teach at least one of the subject that they taught. Being qualified to teach (teaching “in-field”) is when a teacher teaches a subject that they had studied, both content and pedagogy, during their initial teacher education (ITE) or other university studies.
- Arts: -5 percentage points, 2019: 37%; 2020: 32%, English: -2 percentage points, 2019: 27%; 2020:25%, Health/PE: -5 percentage points, 2019: 40%; 2020: 35%, Humanities: -1 percentage points, 2019: 38%; 2020: 37%, LOTE: -3 percentage points, 2019: 30%; 2020:27%, Mathematics: -4 percentage points, 2019:37%; 2020: 33%, Performing Arts: -8 percentage points, 2019: 35%; 2020:27%, Science: -4 percentage points, 2019: 28%; 2020:24%, Technology: -3 percentage points, 2019: 47%; 2020: 44%
- This analysis does not use adjusted intentions, which normally include an adjustment based on the teachers age, and years intending to remain before leaving the profession, as well as indications that retirement was a reason for leaving the profession.
- With only three years of linked data available, and only one with participants from all state and territories this is not explored here.
- With only three years of linked data available, and only one with participants from all state and territories this is not explored here, but will be investigated as the number of registered teachers participating in the Teacher Survey allows.
- Excludes WA graduates, as no linked data from regulatory authorities was available.
- Or who had a gap in their registration since graduation but re-registered prior to or in 2020.
- This analysis excludes ITE students based in Western Australia, however, some teachers from other states may have registered only in Western Australia and would be incorrectly classified as having discontinued their registration. This would reduce the annual rates of registration discontinuation.
- In some jurisdictions, registrations may last for more than one year and their registration may be maintained for this reason.
- Additional analyses show that 12.6% of 2022 departees were early career, 7.4% of 2021 departees were early career, and 4.7% of 2020 departees were early career.
- Classroom teachers: 92%, middle leaders: 91%, senior leaders: 92%
- Classroom teachers: 72%, middle leaders: 72%, senior leaders: 73%
- Classroom teachers: 65%, middle leaders: 53%, senior leaders: 46%
- Indicating selection of reasons like ‘the workload is too heavy’; ‘I am finding it too stressful/it is impacting my wellbeing or mental health’; ‘To achieve a better work/life balance’
- Yellow bars in Figure 16.
- Light grey bars in Figure 16.
- This excludes Western Australia.
- Those who have exited the profession but maintained their registration appear as not deployed in schools or early learning services, and have already been factored into the required growth rates.
- This was to ensure sufficient sample size. As a result, it includes classroom teachers, leaders with teaching roles, and casual/relief teachers or CRTs. With CRTs in this group, the relative differences are more important than the absolute percentages.
- 60% of senior leaders were over 50 years of age in 2020, with 20% aged 60–68 years, and a further 2% already over the retirement age of 69.
- Classroom teachers: 2% undertake 0-9 hours of face-to-face teaching per week; middle leaders: 14%; senior leaders: 48%
- -17 percentage points for migrant teachers compared to -5 percentage points for the teacher workforce.
- The following section refers to preliminary data based on unweighted teacher survey responses. The preliminary data provides a timely snapshot of the workforce but should be considered indicative only.
- 38 hours per week, although most teaching contracts specify only a number of face-to-face hours.
- The following section refers to preliminary data based on unweighted teacher survey responses. The preliminary data provides a timely snapshot of the workforce but should be considered indicative only.