Introduction
Aboriginal and Torres Strait Islander people have a long history of passing knowledge between generations through experiences, observation and storytelling (Gibson et al., 2020). Aboriginal and Torres Strait Islander people’s participation in formal teaching roles within the Australian education system is a relatively recent part of this broader history of education, commencing around the mid-twentieth century. The passing of the 1967 Referendum permitted the Australian Government to create laws and policy regarding Aboriginal and Torres Strait Islander people, a power previously held by the states and territories (Burridge & Chodkiewicz, 2012; Rudolph, 2020). This enabled targeted, federal initiatives that were important for increasing rates of participation among Aboriginal and Torres Strait Islander people across all levels of education (Price, 2012).
![There were an estimated 6,577 registered Aboriginal and Torres Strait Islander teachers[1] nationally in 2020.](https://www.aitsl.edu.au/images/default-source/research/atwd/in-focus/270.jpg?sfvrsn=bb1a843c_2) There were an estimated 6,577 registered Aboriginal and Torres Strait Islander teachers nationally in 2020.
There were an estimated 6,577 registered Aboriginal and Torres Strait Islander teachers nationally in 2020.In the decades following the Referendum, a variety of policy initiatives aimed at enabling Aboriginal and Torres Strait Islander students were enacted. Ongoing efforts to boost the number of Aboriginal and Torres Strait Islander teachers were situated within this broader policy context. For example, in 1977, the National Aboriginal Education Committee (NAEC) was established to advise the Commonwealth Minister for Education on the educational needs of Aboriginal and Torres Strait Islander people, with informed input from communities (Anderson et al., 2020; Gower et al., 2022). One of the major recommendations by the NAEC was to increase the number of Aboriginal and Torres Strait Islander teachers in the workforce – in 1979, only 72 were able to be identified and a target of 1,000 by 1990 was recommended by the NAEC (Price, 2012).
By 1991, the Census identified 946 Aboriginal and Torres Strait Islander teachers in a total workforce estimated at 250,618[3] (ABS, 1994) – this meant teachers who identified as Aboriginal and/or Torres Strait Islander accounted for 0.4% of the teacher workforce in 1991 (ABS, 1991b). While this represented substantial growth in line with the NAEC’s recommendation, achieved at least in part through funded teacher education scholarships, Aboriginal and Torres Strait Islander children comprised about 2.2% of all school-aged children in 1991,[4] five and a half times the proportion of the teacher workforce identifying as Aboriginal and/or Torres Strait Islander (ABS, 1991a).
Later strategies, like the More Aboriginal and Torres Strait Islander Teachers Initiative, built on the NAEC’s recommendations.
The More Aboriginal and Torres Strait Islander Teachers Initiative (MATSITI)
The More Aboriginal and Torres Strait Islander Teachers Initiative (MATSITI) was a Commonwealth-funded project designed to increase the number of Aboriginal and Torres Strait Islander people entering and remaining in the teaching profession (Buckskin, 2016). Commencing in 2012, MATSITI was significant as it aimed to include, and advance, Aboriginal and Torres Strait Islander people in the teaching profession in Australia (Johnson et al., 2016). MATSITI involved several partnership projects, focused on pathways and strategies for Aboriginal and Torres Strait Islander teachers, and a data capture exercise for quantifying this workforce (Johnson et al., 2016).
The data was compiled as part of a ‘point in time’ data collection – the National Teaching Workforce Dataset project, which was a precursor to the ATWD. As part of the initial MATSITI data collection for 2012, 2,661 Aboriginal and Torres Strait Islander teachers were identified, equating to 1.3% of the estimated total teacher workforce (Willett et al., 2014). By 2015, this figure was reported to have increased by 439 teachers, to a new total of 3,100 Aboriginal and Torres Strait Islander teachers (Johnson et al., 2016).[5] This increase was partly due to new Aboriginal and Torres Strait Islander teachers joining the profession between 2012 and 2015, but may have also been due to higher rates of Aboriginal and Torres Strait Islander identification among existing teachers (Buckskin, 2016).
The history of initiatives aimed at collecting data on the Aboriginal and Torres Strait Islander teacher workforce demonstrates progress amid ongoing challenges. Data fragmentation across jurisdictions, school sectors, and data collection systems have made it difficult to collect consistent and comprehensive data on all teachers. Additionally, privacy considerations and the evolving nature of self-identification for Aboriginal and Torres Strait Islander people can add further complexity to data capture (Johnson et al., 2016). Whether a person nominates to identify as Aboriginal and Torres Strait Islander in data collections can be influenced by a range of factors, including perceptions about the purpose of the data collection, perceived cultural safety, exposure to negative historical experiences with data collection, public discourse, and personal circumstances (ABS, 2023a). These and other factors have contributed to self-identification rates varying across jurisdictions, remoteness, age and over time (ABS, 2018).
Despite these challenges, the Australian Teacher Workforce Data (ATWD) initiative offers the most comprehensive national data to date on both the teacher workforce overall, and the Aboriginal and Torres Strait Islander teacher workforce. The ATWD has continually improved teacher workforce data collection since 2017, by combining and linking data from three key sources: initial teacher education (ITE), teacher regulatory authorities (TRAs) and the Australian Teacher Workforce Survey (the Teacher Survey). The first two sources provide population-level data on ITE students enrolled since 2005 and the registered teacher workforce since 2018, which the Teacher Survey supplements with teachers’ self-reported workforce experiences. Through a data linkage process which combines these sources, the ATWD holds de-identified data on each teacher’s career, from ITE to the workforce through to retirement. This process of combining information sources achieves more consistent identification of Aboriginal and Torres Strait Islander teachers in the workforce than any single source could.
Improvements in identifying Aboriginal and Torres Strait Islander teachers, and capturing their workforce experiences, are important and ongoing. All state and territory TRAs have committed to further improve self-identification options for Aboriginal and Torres Strait Islander teachers, which to date has led to nationally consistent measures for self-identification for Aboriginal and Torres Strait Islander teachers from early registration and will, over time, build a more accurate national picture of the workforce.
Furthermore, additions to the Teacher Survey from 2023 include a new section on workplace stress and wellbeing that is coupled with follow-up questions, some of which are of particular relevance to Aboriginal and Torres Strait Islander teachers, including questions on cultural safety and discrimination. The ATWD now also collects data on languages spoken, including Aboriginal and Torres Strait Islander languages, which will increase understanding of whether Aboriginal and Torres Strait Islander teachers are working in communities with which they share a language group. These sets of changes will ensure that the ATWD’s capability to provide analysis and insights into Aboriginal and Torres Strait Islander teachers will increase in breadth and depth over time.
This report offers comprehensive data on the number of Aboriginal and Torres Strait Islander teachers registered across Australia, as well as some key characteristics of this group and their self-reported workforce experiences, as of 2020. This report also summarises national trends in ITE to provide information on the pipeline of Aboriginal and Torres Strait Islander teachers from 2005–2019.
Why is 2020 the most recent year of reported data in the ATWD for Aboriginal and Torres Strait Islander teachers?
The ATWD had national Teacher Survey participation for the first time in 2020. Information on Aboriginal and Torres Strait Islander status comes from a variety of sources in the ATWD. The linkage model allows connection of these sources, which provides a more complete and accurate picture of this group of teachers.
When reporting on the proportion of the workforce with a given characteristic, if this characteristic is measured using variables that rely on linkage to update accurate information (like Aboriginal and Torres Strait Islander identification) it is only available to be reported after linkage, whereas Teacher Survey data, which can be reported without linkage, may be published as preliminary findings. Therefore, at the time of this publication being prepared the most recent linked workforce data available was for 2020, and data on ITE programs was available for 2005-2019.
Size of the registered Aboriginal and Torres Strait Islander teacher workforce
There were 6,027 registered Aboriginal and Torres Strait Islander teachers identified through the ATWD[6] in participating states and territories[7] in 2020. To derive a national estimate of the total size of the registered Aboriginal and Torres Strait Islander teacher workforce, data was estimated for Western Australia. In 2020, there were an estimated 6,577 registered Aboriginal and Torres Strait Islander teachers nationally (Table 1).[8]
The teacher workforce as defined and measured by the ATWD includes data on all people who appear on the teacher regulatory authority registers (“registered teachers”). This includes all registered teachers deployed across schools and early learning settings, including classroom teachers, leaders, casual/relief teachers (CRTs), those not currently working as teachers, and those not currently employed (AITSL, 2023a). Given this uniquely wide scope, the ATWD’s estimate is higher than the figure provided by the Australian Bureau of Statistics, which captures only a headcount of teachers in schools (ABS, 2021a).[9]
It is also important to note that community educators, assistant teachers and Aboriginal and Torres Strait Islander educators[10] play a vital role in supporting Aboriginal and Torres Strait Islander students in schools, particularly in remote areas (AITSL, 2021a). These educators are not captured in the ATWD, which only includes data on registered teachers. Read more about Aboriginal and Torres Strait Islander educators.
Nationally, over half (55%) of all registered Aboriginal and Torres Strait Islander teachers worked in New South Wales in 2020 (n=3,609), with a further 22% in Queensland (n=1,437). These two states also have the largest resident populations of Aboriginal and Torres Strait Islander peoples (ABS, 2021b).
Across states and territories, the Northern Territory had the highest within-state proportion of Aboriginal and Torres Strait Islander teachers in the workforce (4.6%), which is likely due to the higher proportion of Aboriginal and Torres Strait Islander people in the Northern Territory’s working-age population relative to other states and territories (ABS, 2021a).[11] The next highest proportions were in New South Wales (2.0%) and Queensland (1.3%), respectively.
Table 1: State of registration, Aboriginal and Torres Strait Islander teacher workforce, 2020
State | Number of registered Aboriginal and Torres Strait Islander teachers | Proportion of all Aboriginal and Torres Strait Islander registered teachers (national) | Proportion of all registered teachers in the state/territory |
New South Wales | 3,609 | 55% | 2.0% |
Queensland | 1,437 | 22% | 1.3% |
Western Australia[12] | 550 | 8% | 1.2% |
Victoria | 308 | 5% | 0.2% |
Northern Territory | 260 | 4% | 4.6% |
South Australia | 255 | 4% | 0.7% |
Tasmania | 111 | 2% | 1.0% |
Australian Capital Territory | 47 | 1% | 0.9% |
Total | 6,577[13] | 100% | 1.3% |
Registration Status
All teachers must be registered in order to teach, or otherwise hold alternative authorisation to teach, if they are employed in schools. In some states and territories, teachers must also be registered to teach in some early learning settings. There are three registration status types: full, provisional and limited. For the purposes of this data, limited includes ‘permission to teach’ arrangements. Most teachers hold full registration.
In 2020, 75% of the Aboriginal and Torres Strait Islander teacher workforce held full registration, compared to 83% of the wider teacher workforce.
Characteristics of Aboriginal and Torres Strait Islander registered teachers
Demographics
The Aboriginal and Torres Strait Islander teacher workforce is younger than the teacher workforce overall. In 2020, 18% of the Aboriginal and Torres Strait Islander teacher workforce were under 30 years old, and 39% were 30–39 years of age. Only 10% were over 60 and, therefore, approaching the official retirement age.[14] Comparatively, in 2020, 12% of the whole teacher workforce was under 30, followed by 26% between 30–39 years of age. Those aged over 60 comprised 18% of the whole teacher workforce in 2020.
In 2020, 77% of the Aboriginal and Torres Strait Islander teacher workforce were women, which was very similar to the proportion of women in the whole teacher workforce (76%). This is unlikely to change, given that most commencing ITE students are women.
Schools/workplaces
Position in school
As shown in Figure 1,[15] 61% of Aboriginal and Torres Strait Islander teachers working in schools were classroom teachers and 9% were casual/relief teachers (CRTs) in 2020.[16] Nearly one-third of the Aboriginal and Torres Strait Islander teacher workforce working in schools[17] held a leadership position, with 17% holding a middle leadership role and 14% holding a senior leadership role. Comparatively, the wider workforce had a similar distribution of positions in schools in 2020, with the most notable differences including a slightly higher proportion of middle leaders (21%) and a slightly lower proportion of senior leaders (10%; AITSL, 2023a).
Figure 1: Position in school, 2020
School sector
The proportion of Aboriginal and Torres Strait Islander teachers deployed in the government school sector is disproportionately large, when compared to both the wider workforce and the proportion of teachers in government schools nationally.[18] Four-fifths (80%) of the Aboriginal and Torres Strait Islander teacher workforce deployed in schools were employed in the government school sector in 2020, with much smaller proportions working in Catholic schools (12%) and independent schools (8%). In the wider workforce, 67% of teachers were employed in government schools in 2020, with 17% employed in the Catholic sector and 17% in the independent sector.
School type
In 2020, nearly half (46%) of the Aboriginal and Torres Strait Islander teacher workforce were deployed in primary schools, 35% were deployed in secondary schools, 15% in combined schools,[19] and 3% in special schools.
Although the types of schools Aboriginal and Torres Strait Islander teachers worked in were broadly comparable with the whole workforce,[20] Aboriginal and Torres Strait Islander teachers were somewhat more likely to be working in primary settings (46%) relative to the whole workforce (40%).
Remoteness
One of the most notable differences in characteristics between the wider teacher workforce and the Aboriginal and Torres Strait Islander teacher workforce is workplace remoteness.[21] In 2020, 48% of the Aboriginal and Torres Strait Islander teacher workforce were working in regional or remote areas, compared to 34% of all teachers (Figure 2).
Aboriginal and Torres Strait Islander teachers deployed in regional and remote schools and early childhood settings play a vital role in these education systems. Regional and remote schools are often associated with a higher proportion of Aboriginal and Torres Strait Islander students (ABS, 2021). As schools in regional and remote areas may face higher teacher turnover, Aboriginal and Torres Strait Islander teachers provide continuity of learning, as well as both cultural and community knowledge (AITSL, 2021a).
Figure 2: Workplace remoteness, 2020
Teacher workforce experiences by remoteness (all teachers)
Recent data from National Trends: Teacher Workforce highlighted some differences in workforce experiences between teachers working in major cities and those in regional and remote areas. While these findings relate to the whole teacher workforce, they may offer some initial insights into the workforce experiences of Aboriginal and Torres Strait Islander teachers, who are more likely to be working in regional and remote areas.
In 2020, 80% of the remote and very remote[22] teacher workforce was employed full-time, compared to 69% of the teacher workforce working in major cities. Moreover, 69% of the full-time teacher workforce in remote and very remote areas reported working over 50 hours per week, compared to 60% of the full-time teacher workforce in major cities. The tendency to work longer hours may be due to greater teacher shortages in remote areas, which could contribute to both the increased rates of full-time work and longer working hours than teachers in major cities (AITSL, 2023a).
In 2020, 46% of all leaders (middle and senior leadership roles combined) in regional and remote areas reported fewer than 5 years of leadership experience, compared to 41% of leaders in major cities. Additionally, 32% of regional and remote leaders had 10 or more years of leadership experience, compared to 39% of leaders in major cities. The finding that leaders in regional and remote areas have slightly less leadership experience than their counterparts in major cities may be associated with decreasing numbers of teaching staff (and student enrolments) as school remoteness increases. As a result of the longstanding staffing difficulties that regional and remote schools face, teachers in earlier stages of their career in regional and remote areas are somewhat more likely to move into leadership positions than teachers in major cities (Graham et al. 2009).
Despite these differences in workforce experiences, teachers in remote and very remote areas reported similar career intentions to teachers in major cities – in 2020, 22% intended to leave the profession before retirement (major cities: 21%), and 45% intended to stay until retirement (major cities: 46%).
Years in the profession
In line with the age distribution of the Aboriginal and Torres Strait Islander teacher workforce, most Aboriginal and Torres Strait Islander teachers have over 10 years of experience in the teaching profession (Figure 3). However, the workforce is slightly less experienced than the wider workforce, largely due to a greater proportion of teachers with 1–9 years in the profession.
In 2020, 38% of the Aboriginal and Torres Strait Islander teacher workforce had been in the teaching profession for 1–9 years, 32% had 10–19 years of experience in the profession, while 15% had over 30 years in the profession. Comparatively, 29% of all teachers had 1–9 years in the profession, 26% had 10–19 years’ experience and 26% had over 30 years in the profession.
Figure 3: Years in the teaching profession, 2020
The importance of early career teacher induction
In 2020, 56% of Aboriginal and Torres Strait Islander early career teachers[23] reported receiving a formal induction (up from 47% in 2019), compared to 63% of early career teachers in the wider teacher workforce (up from 61% in 2019).
Induction is an important opportunity for early career teachers to build on their knowledge and experiences from ITE, by introducing them to the school community and the school and teaching environment, while enhancing their pedagogy and professional identity. Induction plays an important role in teacher retention by providing new teachers with the support, guidance, and resources they need to be successful (Kidd et al., 2015). It can also help early career teachers to develop their practice while meeting the challenges and demands of their workload and managing their wellbeing (AITSL, 2022; AITSL, 2023a).
Leaders’ years in the profession
Aboriginal and Torres Strait Islander leaders reported fewer years in the profession than all leaders. In 2020, 25% of Aboriginal and Torres Strait Islander leaders reported fewer than 10 years in the teaching profession, compared to 12% of leaders in the whole workforce, while 19% of Aboriginal and Torres Strait Islander leaders had more than 30 years in the profession in 2020, compared to a third (33%) of all leaders (Figure 4).[24]
The tendency for Aboriginal and Torres Strait Islander teachers to move into leadership earlier is a notable trend that may be influenced by a combination of factors, including workplace remoteness and overall years in the profession. As reported above, in 2020, the Aboriginal and Torres Strait Islander teacher workforce was more likely to be deployed in regional and remote areas, which previous ATWD reporting found was associated with relatively quicker transitions into leadership compared to the wider teacher workforce (AITSL, 2023a).
Figure 4: Years in the teaching profession for leaders, 2020
Workforce experiences
Employment arrangements (contracts and contracted hours)
In 2020, nearly three-quarters (74%) of the Aboriginal and Torres Strait Islander teacher workforce were employed on an ongoing/permanent contract, followed by employment on a fixed-term contract[25] (18%) and employment as a casual/relief teacher (9%). This distribution of employment arrangements was comparable to the wider teacher workforce with only 1 percentage point difference in all categories.[26]
As shown in Figure 5,[27] two-thirds (66%) of the Aboriginal and Torres Strait Islander teacher workforce were employed full-time (0.95–1 FTE) in 2020, with 14% employed to work 4 days a week (0.8–0.94 FTE), and 20% employed to work for less than 4 days a week (<0.79 FTE)[28]. By comparison, only 59% of the wider teacher workforce were employed full-time in 2020, with a higher proportion employed to work under 4 days per week (27%).
Figure 5: Contracted hours (full-time equivalent), 2020
Face-to-face teaching hours
In 2020, 60% of full-time Aboriginal and Torres Strait Islander classroom teachers reported undertaking more than 25 hours of face-to-face teaching per week, which exceeds the allotted hours set out in enterprise bargaining agreements (EBAs).[29] This is notably higher than full-time classroom teachers in the wider workforce, where less than half (48%) of teachers reported more than 25 hours of face-to-face teaching in 2020 (Figure 6).[30]
There are two factors that may be contributing to the higher proportion of Aboriginal and Torres Strait Islander full-time teachers reporting more than 25 face-to-face teaching hours – a higher proportion of primary school teachers among the Aboriginal and Torres Strait Islander teacher workforce, and a higher proportion of teachers in regional and remote areas. Firstly, there is a higher proportion of Aboriginal and Torres Strait Islander primary school teachers (46%) compared to the wider workforce (40%). This is important, because primary teachers tend to report more face-to-face teaching hours than secondary teachers (AITSL, 2021b). This is compounded by the fact that even among full-time primary school teachers, Aboriginal and Torres Strait Islander primary teachers were more likely to report 25 or more face-to-face teaching hours (67%) than primary teachers in the wider workforce (59%). Secondly, there is a greater proportion of Aboriginal and Torres Strait Islander teachers working in regional and remote areas, which is associated with higher working hours (AITSL, 2023a).
Figure 6: 25+ hours of face-to-face teaching per week (full-time classroom teachers) by school type, 2020
Teacher duties
Although face-to-face teaching constitutes a large part of the work week, classroom teachers also undertake various duties including lesson planning, administrative tasks, marking and supervision. Alongside face-to-face teaching, these tasks are also critical to supporting the effective delivery of teaching and learning.
In 2020, Aboriginal and Torres Strait Islander teachers devoted more time per week outside the classroom to lesson planning, supervision and administrative tasks than other teacher duties. For example, 27% of Aboriginal and Torres Strait Islander teachers reported spending 10 or more hours per week on lesson planning, 12% reported 10 or more hours on supervision and 11% reported 10 or more hours on administrative tasks (Figure 7). This is broadly comparable with the wider teacher workforce.[31]
Figure 7: Teacher duties, Aboriginal and Torres Strait Islander teacher workforce, 2020
There was a slight reduction in reported time spent for some teacher duties from 2019 to 2020, which may have been due to the COVID-19 pandemic. For example, the proportion of Aboriginal and Torres Strait Islander teachers spending 10 or more hours on lesson planning fell from 38% in 2019 to 27% in 2020 (-11 percentage points), while administrative tasks fell by 5 percentage points over the same period (Figure 8). This trend was also reflected in the wider teacher workforce, but to a lesser extent.[32]
Figure 8: Teacher duties (10+ hours per week), Aboriginal and Torres Strait Islander teacher workforce, 2019–2020
Career intentions
Reported intentions to leave the teaching profession before retirement moderately declined for the Aboriginal and Torres Strait Islander teacher workforce from 34% in 2019 to 29% in 2020.[33] In 2020, more Aboriginal and Torres Strait Islander teachers reported their intent to remain in the profession until retirement (36%) or were unsure about their career intentions (35%) than in 2019 (Figure 9). In 2020, the Aboriginal and Torres Strait Islander teacher workforce also reported higher intentions to leave before retirement compared to the wider workforce (29% vs. 21%), lower intentions to remain (36% vs. 46%) and similar levels of uncertainty (35% vs. 33%) (AITSL, 2023b). There are many factors potentially contributing to this difference. For instance, teachers under the age of 55 are more uncertain about their long-term career intentions, and Aboriginal and Torres Strait Islander teachers are younger than the workforce overall (AITSL, 2023a).
Retirement
Across Australia, although the average age people intend to retire is 65.5 years, the average age at retirement is 56.3 years (ABS, 2023b). Among the teacher workforce in Australia, some teachers make a shift into CRT roles in their 60s, which may be a way of transitioning to retirement through reducing hours.
Understanding career longevity is about more than reported career intentions. For Aboriginal and Torres Strait Islander teachers, reported intentions to remain in the profession until retirement may not translate into long-term retention due to broader social factors. For example, the average Aboriginal and Torres Strait Islander person born in 2018 is expected to have 15 fewer years in full health than non-Indigenous Australians (AIHW, 2022). This large gap is likely worse for generations of Aboriginal and Torres Strait Islander people born before 2018. This means that even if age-matched career intentions and anticipated age of retirement were comparable, it is possible that Aboriginal and Torres Strait Islander teachers who intended to stay until retirement are more likely to have an unplanned health-related workforce exit compared to the workforce overall.
Reported intentions to leave the profession before retirement do not necessarily translate into actual attrition. International data suggests that rates of reported intentions to leave the profession of 30–40% may result in actual turnover closer to 10–15% (Räsänen et al., 2020).[34] There is a notable proportion of Aboriginal and Torres Strait Islander teachers who report that they intend to leave the profession before retirement, but they are unsure when (6% in 2020), and an even larger group who are unsure whether they will remain until or leave before retirement (35% in 2020). Given these high levels of uncertainty, which are slightly higher than across the wider workforce, there is considerable scope for these teachers to be retained in the profession through targeted, evidence-based retention strategies.
Those who report more immediate plans to leave, however, may have concrete intentions to actually depart the profession. Previous ATWD analysis of teacher registration data for the wider workforce demonstrated that intentions to leave in the immediate future (that is, within one year or less) were only slightly higher than actual rates of registration discontinuation (AITSL, 2023a). The percentage of the whole teacher workforce that intended to leave the profession in one year or less in 2019, and therefore would not be expected to be part of the 2020 teacher workforce if their intentions were accurate, was 2.4%. This was slightly higher than the average rate of registration discontinuation among early career teachers up to 2020, at 1.28 percentage points (AITSL, 2023a). This suggests intentions to leave within one year may provide a somewhat accurate measure of actual behaviour.
When looking at immediate and short-term plans to leave the profession (leave in 1-4 years) in 2020, 7.7% of Aboriginal and Torres Strait Islander teachers intended to leave within four years, compared to 5.3% of the wider workforce. Even if this does not translate to higher attrition, it highlights the importance of retention efforts.[35]
At present, actual attrition in the Aboriginal and Torres Strait Islander teacher workforce cannot be determined. Future ATWD reporting, which covers multiple years and data sources, will be better placed to confirm the nature of the relationship between reported career intentions and actual attrition for Aboriginal and Torres Strait Islander teachers and the wider workforce.
Figure 9: Career intentions, Aboriginal and Torres Strait Islander teacher workforce, 2019–2020
Commencements
Commencements form the first stage of the ITE pipeline and include students who are commencing an ITE program for the first time in any given year. Commencements provide an important indicator of potential future supply and act as a leading indicator for ITE completions, depending on the level of attrition in commencing cohorts.
A total of 644 Aboriginal and Torres Strait Islander students commenced an ITE program in 2019. ITE commencements have generally trended upwards over time for Aboriginal and Torres Strait Islander students – compared to 2005 (n=536), there has been a 20% increase in ITE commencements (Figure 10). However, after Aboriginal and Torres Strait Islander ITE commencements peaked in 2015 (n=825), commencements then declined over the period from 2017 to 2019, with a notable decrease in commencements occurring in 2018. The broader trend from 2017 to 2019 was also evident nationally for all ITE commencements (AITSL, 2023a).
 While these characteristics of enrolled students have changed over time, the proportion of students who are women, report a disability, and live in regional/remote areas remained relatively constant. Due to cell size requirements, the proportion of enrolled (rather than commencing) Aboriginal and Torres Strait Islander ITE students is used.
 Figure 10:Total commencements, Aboriginal and Torres Strait Islander ITE students, 2005–2019
Commencement trends and policy impacts
As shown in Figure 11,[37] Aboriginal and Torres Strait Islander ITE commencements generally increased between 2005 and 2011.[38] However, from 2012, policy changes to Commonwealth Supported Places (CSPs)[39] coincided with changes in ITE commencement growth for Aboriginal and Torres Strait Islander students.
In 2012, Aboriginal and Torres Strait Islander ITE commencements increased by 19% (+120 commencements) from 2011 numbers, compared to a 7% increase for all ITE students. These increases in commencements in 2012 coincided with the Australian Government’s full implementation of a demand-driven funding system for public universities by 2012, removing the previously existing caps on CSPs under the supply-driven system.[40]
The removal of the CSP caps in 2012 may have assisted in driving sustained increases in Aboriginal and Torres Strait Islander commencements from 2012 to 2016 (+59 commencements, +8%). It is also possible that MATSITI simultaneously contributed to growth in commencements during the 2012 to 2016 period. For example, under MATSITI, funding was provided for a series of partnerships with universities, including a focus on providing alternate school to university pathways for Aboriginal and Torres Strait Islander students (Johnson et al., 2016).
In 2018, Aboriginal and Torres Strait Islander ITE commencements dropped by 19% (-148 commencements), resulting in commencements declining back to their lowest level since 2011. A 19% fall in commencements across all ITE students was also recorded in 2018. The sharp decline in commencements may be explained by the Australian Government’s decision to freeze funding for CSPs in December 2017 – where the total level of funding under the Commonwealth Grant Scheme (CGS) for 2018 and 2019 was capped at the 2017 funding level (Department of Education, 2020). The funding freeze may have impacted the allocation of CSP places and the ability of universities to attract and retain students seeking a CSP (AITSL, 2024).
Figure 11: Indexed commencement growth by cohort, 2005–2019
Recent changes to Commonwealth Grant Scheme funding
In 2019, the Australian Government reversed the funding freeze on CSPs that had been implemented two years prior. This policy change resulted in additional funding for universities from 2020, based on population growth of 18- to 64-year-olds and university performance. Then in 2021, the Government used its Job-ready Graduates Package to enact more policy changes, including a shift back to demand-driven funding (like the funding model in place up to 2017) for all Aboriginal and Torres Strait Islander university students from regional and remote parts of Australia (Department of Education, 2023a). In July 2023, in response to the Australian Universities Accord Interim Report, the Australian Government expanded this policy change, by guaranteeing CSPs to all Aboriginal and Torres Strait Islander students regardless of where they live in Australia (Clare, 2023).
These policy changes may impact undergraduate commencements of Aboriginal and Torres Strait Islander ITE students from 2020, though there are competing factors, including employment and accessibility constraints. In addition, some stakeholders have claimed that the effects of the Job-ready Graduates Package have been negative in other ways, including reductions to some university funding tied to priority fields including education (Department of Education, 2023b). Future ATWD reporting will be able to provide greater insight into any specific or broad-based changes in ITE programs that may result from government policies.
Commencing student characteristics
Degree type
In 2019, 86% of Aboriginal and Torres Strait Islander ITE commencements were at the undergraduate level, and 14% were at the postgraduate level (Figure 12). There has been a gradual increase in the proportion of Aboriginal and Torres Strait Islander postgraduate ITE commencements, increasing from 6% of commencements in 2005 to 14% in 2019 (+8 percentage points). However, by comparison, 32% of all ITE commencements were postgraduate in 2019 – highlighting that Aboriginal and Torres Strait Islander students remained underrepresented at the postgraduate level.
Underrepresentation of Aboriginal and Torres Strait Islander students across all forms of postgraduate study has existed for some time (Andrews et al., 2023). Postgraduate ITE study requires an undergraduate degree, and there are lower rates of undergraduate degrees among the Aboriginal and Torres Strait Islander population compared to the national population.[41] For example, the National Aboriginal and Torres Strait Islander Postgraduate Association (NATSIPA) was formed in 1999 in response to a project partially funded by the then Department of Education, Employment and Training, which identified specific barriers faced by Aboriginal and Torres Strait Islander postgraduates (NATSIPA, 2023).
Figure 12: ITE program type, 2019
Study mode
There are three modes of study for ITE: on-campus programs, online programs and multi-modal[42] programs.
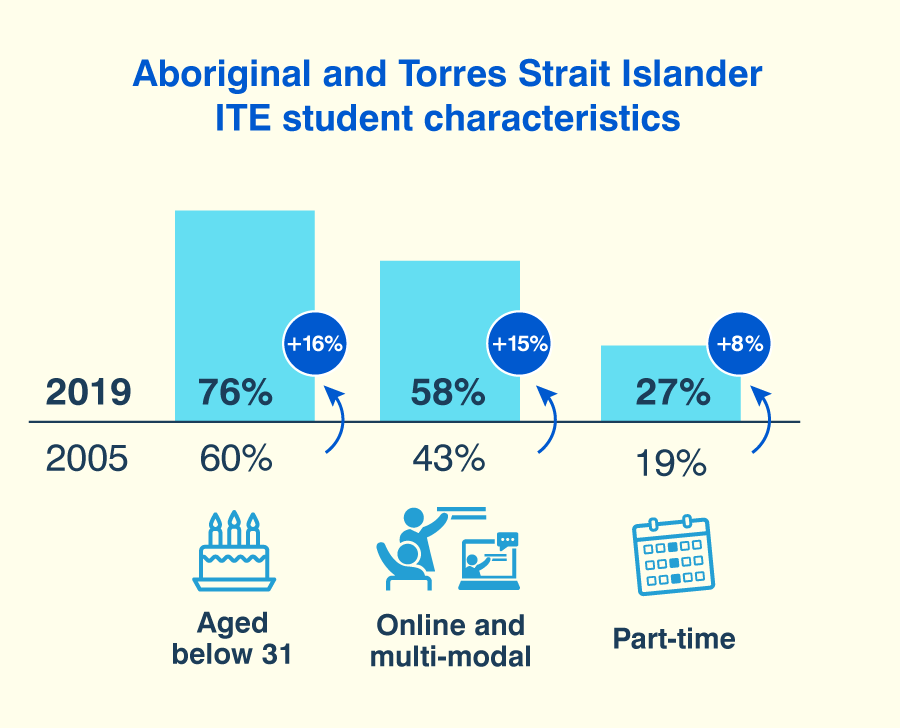
In 2019, online and multi-modal programs accounted for a combined 51%[43] of all Aboriginal and Torres Strait Islander ITE commencements, an 18-percentage point increase from 33%[44] in 2005 (Figure 13). The steady increase in online and multi-modal program commencements may reflect both a growing preference for flexibility in tertiary studies and growth in the availability of online programs. This increase in online and multi-modal study is also true for all ITE students, with these modes of attendance accounting for 44% of commencements in 2019 (+11 percentage points growth since 2005).
Figure 13: Study mode for ITE program commencements, Aboriginal and Torres Strait Islander students, 2005–2019
Study load
Nearly three-quarters (73%) of commencing Aboriginal and Torres Strait Islander ITE students studied full-time in 2019. However, since 2005, there has been a gradual increase in the proportion of Aboriginal and Torres Strait Islander ITE students studying part-time.
Part-time students comprised 27% of commencements by Aboriginal and Torres Strait Islander students in 2019, an 8-percentage point increase from 2005 (19%). In contrast, part-time study was less common in ITE students overall, with 19% of commencing students studying part-time in 2019; a 3-percentage point increase since 2005.
Completion rates
Students progress through the ITE pipeline on different timelines to others in their cohort.[49] Within any given cohort, there are three possible student outcomes: students could have completed their studies, discontinued their ITE program or remain enrolled.
Completion rates help with understanding this progression of students, in a given cohort, through the ITE pipeline. Completion rates are calculated as the proportion of a commencing cohort who completed an ITE program over a 4-year (postgraduate) or 6-year (undergraduate) timeframe. Trends in completion rates can be useful for estimating potential future teacher supply, because they show what proportion of commencing students in a cohort are likely to complete their degree.
Read more about completion rates and how they’re calculated.
Trends over time – policy changes in ITE
As part of the implementation of the Accreditation of initial teacher education programs in Australia: Standards and Procedures (Standards and Procedures), postgraduate programs gradually transitioned from 1-year to 2-years in length. This process occurred between 2013 and 2018, with postgraduate primary programs transitioning by 2015 and secondary programs transitioning by 2018. This policy shift away from 1-year programs is particularly important to consider in the context of completion rates and first-year attrition data. Given that, in general, longer programs have lower completion rates, the move to 2-year postgraduate programs has corresponded to decreases in postgraduate completion rates over time. First-year attrition was not applicable when postgraduate programs were one year in length.
Read more about policy changes in ITE.
Completion rates by degree type
Completion rates for all ITE students have been declining since 2005. Despite this, across both undergraduate and postgraduate programs, Aboriginal and Torres Strait Islander ITE completion rates declined at a slower rate relative to all ITE students.[50]
For the 2014 cohort, 6-year undergraduate completion rates for Aboriginal and Torres Strait Islander ITE students were 37%, a decline of 4 percentage points relative to the 2005 cohort (Figure 15). Over the same period, 6-year undergraduate completion rates for all ITE students fell by 12 percentage points to 50%, reducing the gap in undergraduate completion rates between the groups.[51]
Given that more than 85% of Aboriginal and Torres Strait Islander ITE commencements are undergraduate, improving undergraduate completion rates represent a key opportunity to enhance the progression of Aboriginal and Torres Strait Islander ITE students through the pipeline.
Figure 15: Undergraduate completion rates, by cohort, 2005–2014
Four-year postgraduate completion rates for Aboriginal and Torres Strait Islander ITE students were 73% for the 2016 cohort, a decrease of 4 percentage points compared to the 2007 cohort. As 4-year postgraduate completion rates for all ITE students also fell from 86% to 74% over the same period (-12 percentage points), only a 1-percentage point difference remained between the postgraduate completion rates for both groups in 2016 (Figure 16). It is important to note that the decline in postgraduate completion rates across all ITE students is likely due to the shift from 1-year to 2-year postgraduate ITE programs which occurred over the period from 2011-2018.
Figure 16: Postgraduate completion rates, by cohort, 2005–2016
The potential impact of online study on teacher supply
As shown previously in Figure 13, there has been a notable increase in the proportion of Aboriginal and Torres Strait Islander ITE students commencing their studies online over the period from 2012 to 2019.
Recent analysis in the ATWD National Trends: Initial Teacher Education Pipeline publication indicated that among all undergraduate ITE students commencing in 2016, completion rates were considerably lower for students who studied online (37%) compared to those who studied on-campus (54%) or multi-modally (54%).
Given that, in 2019, nearly one-third (29%) of all commencing Aboriginal and Torres Strait Islander ITE students studied online in their first-year of study, this may impact teacher supply in the future. In particular, if the proportion of Aboriginal and Torres Strait Islander ITE students studying online increases, but online completion rates remain lower than multi-modal and on-campus completion rates, this will likely reduce the number of students completing their ITE program and progressing into the profession.[52]
Further analysis in the ATWD National Trends: Initial Teacher Education Pipeline has shown that the proportion of online commencements among all ITE students continued to rise in 2020 and 2021, during the COVID-19 pandemic. If this trend also holds for Aboriginal and Torres Strait Islander ITE students, it will be important for ITE providers to consider both the design and delivery of ITE programs to ensure they are fit-for-purpose for the mode of delivery, as well as ensuring that there is sufficient student engagement in these programs, which will likely aid in retaining Aboriginal and Torres Strait Islander students in the ITE pipeline.
However, it is also important to acknowledge that completion rates are affected by a complex combination of factors, which may include study mode, remoteness and age (AITSL, 2024). Additionally, lower completion rates are not necessarily caused by online study, as study characteristics can covary. Read more about interpreting completion rates data.
References
Anderson, P. J., Maeda, K., Diamond, Z. M., & Sato, C. (2020). Introducing Indigenous education in Japan and Australia. In Post-Imperial Perspectives on Indigenous Education: Lessons from Japan and Australia (pp. 1-22). Taylor and Francis.
Andrews, S., Mazel, O., & Padgham, W. (2023). Enabling higher degree pathways for Aboriginal and Torres Strait Islander students. The Australian Educational Researcher, 1-20.
Australian Curriculum, Assessment and Reporting Authority (ACARA). (2023). School Numbers. ACARA. https://www.acara.edu.au/reporting/national-report-on-schooling-in-australia/school-numbers
Australian Bureau of Statistics. (1994). Participation in Education: Education of Aboriginal and Torres Strait Islander people, May 1994. ABS. https://www.abs.gov.au/ausstats/[email protected]/2f762f95845417aeca25706c00834efa/cfe3b53d5a626920ca2570ec00786344!OpenDocument
Australian Bureau of Statistics. (1991a). Census Working Paper 93/6 - Aboriginal/Torres Strait Islander Counts, February 1991. ABS. https://www.abs.gov.au/ausstats/[email protected]/d36c95a5d2ce6cedca257098008362c8/45333e72a039d21cca2570610031b059!OpenDocument
Australian Bureau of Statistics. (1991b). Census Working Paper 94/2 - Education, September 1991. ABS. https://www.abs.gov.au/ausstats/[email protected]/2411a086dd21a2f4ca25704c001c62b2/688719d950fb14f3ca2570610032382c!OpenDocument
Australian Bureau of Statistics (2018). Identification as an Aboriginal and Torres Strait Islander Person in the Census over time, December 2018. ABS. https://www.abs.gov.au/ausstats/[email protected]/Lookup/by%20Subject/2081.0~ACLD~Main%20Features~Identification%20as%20an%20Aboriginal%20and%20Torres%20Strait%20Islander%20person%20in%20the%20Census%20over%20time~10002
Australian Bureau of Statistics (2019). Estimates and Projections, Aboriginal and Torres Strait Islander Australians. ABS data explorer. https://explore.data.abs.gov.au/vis?fs[0]=People%2C0%7CAboriginal%20and%20Torres%20Strait%20Islander%20Peoples%23ATSIP%23&pg=0&fc=People&df[ds]=PEOPLE_TOPICS&df[id]=ABORIGINAL_POP_PROJ&df[ag]=ABS&df[vs]=1.0.0&pd=2016%2C&dq=POP_PROJ.3.A15%2BA10%2BA59%2BA04%2BTT.0%2B1%2B2%2B3%2B4%2B5%2B6%2B7%2B8.1.A&ly[cl]=ASGS_2011&ly[rw]=TIME_PERIOD&ly[rs]=AGE
Australian Bureau of Statistics. (2021a). Census of Population and Housing – TableBuilder data, 2021. ABS. https://www.abs.gov.au/statistics/microdata-tablebuilder/tablebuilder
Australian Bureau of Statistics. (2021b). Estimates of Aboriginal and Torres Strait Islander Australians. ABS. https://www.abs.gov.au/statistics/people/aboriginal-and-torres-strait-islander-peoples/estimates-aboriginal-and-torres-strait-islander-australians/latest-release
Australian Bureau of Statistics. (2023a). Understanding change in counts of Aboriginal and Torres Strait Islander Australians: Census 2021. ABS. https://www.abs.gov.au/statistics/people/aboriginal-and-torres-strait-islander-peoples/understanding-change-counts-aboriginal-and-torres-strait-islander-australians-census/latest-release
Australian Bureau of Statistics. (2023b). Retirement and Retirement Intentions, Australia. ABS. https://www.abs.gov.au/statistics/labour/employment-and-unemployment/retirement-and-retirement-intentions-australia/latest-release
Australian Institute of Health and Welfare. (2022). Australian Burden of Disease Study: impact and causes of illness and death in Aboriginal and Torres Strait Islander people 2018. Australian Burden of Disease Study series no. 26, catalogue number BOD 32. AIHW. Australian Government.
Australian Institute for Teaching and School Leadership. (2023a). ATWD National Trends: Teacher Workforce. https://www.aitsl.edu.au/research/australian-teacher-workforce-data/atwdreports/national-trends-teacher-workforce
Australian Institute for Teaching and School Leadership. (2023b). Spotlight Australia’s teacher workforce today. https://www.aitsl.edu.au/research/spotlights/australia-s-teacher-workforce-today
Australian Institute for Teaching and School Leadership. (2023c). ATWD National Trends: Initial Teacher Education Pipeline (Mar 2023 edition., 2005-2019). https://www.aitsl.edu.au/research/australian-teacher-workforce-data/atwdreports/national-trends-ite-pipeline-mar2023
Australian Institute for Teaching and School Leadership. (2024). ATWD National Trends: Initial Teacher Education Pipeline (Feb 2024 ed., 2005-2021). https://www.aitsl.edu.au/research/australian-teacher-workforce-data/atwdreports/national-trends-ite-pipeline-feb2024
Australian Institute for Teaching and School Leadership. (2022). Classroom Management: Standards-aligned evidence-based approaches. https://www.aitsl.edu.au/research/spotlights/classroom-management-standards-aligned-evidence-based-approaches
Australian Institute for Teaching and School Leadership. (2021a). The impact of Aboriginal and Torres Strait Islander educators. https://www.aitsl.edu.au/research/spotlights/the-impact-of-aboriginal-and-torres-strait-islander-educators
Australian Institute for Teaching and School Leadership. (2021b). Australian Teacher Workforce Data: National Teacher Workforce Characteristics Report, December 2021. https://www.aitsl.edu.au/docs/default-source/atwd/national-teacher-workforce-char-report.pdf?sfvrsn=9b7fa03c_4
Buckskin, P. (2016). More Aboriginal and Torres Strait Islander Teachers Initiative. Final Report. Adelaide, University of South Australia. http://hdl.voced.edu.au/10707/424970
Burridge, N., & Chodkiewicz, A. (2012). An historical overview of Aboriginal education policies in the Australian context. In Indigenous education (pp. 9-21). Brill.
Department of Education. (2020). Higher Education Policy changes - Provider FAQs. Commonwealth of Australia Department of Education. https://www.education.gov.au/quality-and-legislative-frameworks/higher-education-policy-changes-provider-faqs
Department of Education. (2023a). More opportunities for regional Australia. Commonwealth of Australia Department of Education. https://www.education.gov.au/job-ready/more-regional-opportunities
Department of Education. (2023b). Australian Universities Accord Interim Report. Commonwealth of Australia Department of Education. https://www.education.gov.au/australian-universities-accord/resources/accord-interim-report
Department of Social Services (2023). Benefits and Payments: Age Pension. Commonwealth of Australia, Department of Social Services. https://www.dss.gov.au/seniors/benefits-payments/age-pension
Clare, J. (2023). Australian Universities Accord Interim Report and immediate actions [Media release]. Ministers of the Education Portfolio. https://ministers.education.gov.au/clare/australian-universities-accord-interim-report-and-immediate-actions
Gibson, C., Dudgeon, P., & Crockett, J. (2020). Listen, look & learn: Exploring cultural obligations of Elders and older Aboriginal people. Journal of Occupational Science, 27(2), 193-203. https://doi.org/10.1080/14427591.2020.1732228
Gower, G., Bogachenko, T., & Oliver, R. (2022). On country teacher education: Developing a success program for and with future Aboriginal teachers. Australian Journal of Teacher Education (Online), 47(7), 1-20.
Graham, L., Patterson, D., & Miller, J. (2009). Early career leadership opportunities in Australian rural schools. Education in rural Australia, 19(3), 26-36. https://doi.org/10.47381/aijre.v19i3.573
Johnson, P., Cherednichenko, B., & Ros, M. (2016). Evaluation of the More Aboriginal and Torres Strait Islander Teachers Initiative project. https://www.edutech.com.au/matsiti/wp-content/uploads/2020/06/MATSITI-2016-Project-Evaluation-Final-Report.pdf
Kidd, L., Brown, N., & Fitzallen, N. (2015). Beginning Teachers' Perception of Their Induction into the Teaching Profession. Australian journal of teacher education, 40(3), 154-173. https://ro.ecu.edu.au/ajte/vol40/iss3/10/
National Aboriginal and Torres Strait Islander Postgraduate Association. (2023). About NATSIPA: 1992 and NIPAAC’s Creation. NATSIPA. https://natsipa.edu.au/history/
Price, K. (2012). A brief history of Aboriginal and Torres Strait Islander education in Australia. In Aboriginal and Torres Strait Islander education: An introduction for the teaching profession, 1-20. Cambridge University Press.
Räsänen, K., Pietarinen, J., Pyhältö, K., Soini, T., & Väisänen, P. (2020). Why leave the teaching profession? A longitudinal approach to the prevalence and persistence of teacher turnover intentions. Social Psychology of Education, 23(4), 837–859. https://doi.org/10.1007/s11218-020-09567-x
Rudolph, S. (2019). To “uplift the Aborigine” or to “uphold” Aboriginal dignity and pride? Indigenous educational debates in 1960s Australia. Paedagogica Historica, 55(1), 152-165.
Willett, M., Segal, D., & Walford, W. (2014). National Teaching Workforce Dataset data analysis report 2014. Commonwealth of Australia Department of Education. https://apo.org.au/sites/default/files/resource-files/2014-10/apo-nid41845_5.pdf
Endnotes
1. This is the estimated number of registered teachers who identified that they are Aboriginal and/or Torres Strait Islander, in at least one of the ATWD data sources.
2. In New South Wales, registered teachers are referred to as ‘accredited teachers’. Accredited teachers in New South Wales are included in TRA data within the ATWD.
3. Using a rate of 145 teachers per 10,000 for the total population. The Census captured the estimated number of teachers who identified that they were Aboriginal and/or Torres Strait Islander.
4. This estimate relies on counts for primary and secondary only.
5. This closure report did not report a percentage or totals in relation to the whole workforce for 2015.
6. While this data is derived from the triangulation of ITE, TRA and Survey data, the total workforce may still be underestimated as it requires a teacher to self-identify in at least one of the data sources in the ATWD.
7. All states and territories excluding Western Australia (WA) – registration data is not available for WA in 2020. Future ATWD reporting will be able to provide the observed number of registered Aboriginal and Torres Strait Islander teachers in each state and territory, with data from all TRAs becoming available for linkage as of 2023.
8. As registration data was not available for Western Australia in 2020, the number of registered Aboriginal and Torres Strait Islander teachers in Western Australia was estimated by calculating the mean proportion of Aboriginal and Torres Strait Islander teachers in the working-age population across all states and territories excluding Western Australia (1.09%), multiplied by the Aboriginal and Torres Strait Islander working-age population in Western Australia (n = 50,162), resulting in an estimate of approximately 550 Aboriginal and Torres Strait Islander teachers in Western Australia.
9. The 2021 Census of Population and Housing (2021 Census) identified 6,086 Aboriginal and Torres Strait Islander teachers nationally.
10. Aboriginal and Torres Strait Islander educators are referred to differently, depending on the state and territory they work in. For example, Aboriginal and Torres Strait Islander educators are referred to as Assistant Teachers in the NT, Aboriginal and Islander Education Officers (AIEO) in WA; Community Education Counsellors (CEC) in QLD; Koorie Engagement Support Officers (KESOs) and Aboriginal community education officers (ACEOs) in SA (AITSL, 2021a). This is not an exhaustive list.
11. 26.7% of the working-age population in the Northern Territory identified as Aboriginal and Torres Strait Islander in 2021. The average across all other states and territories was 3.0% (ABS, 2021).
12. The number of registered teachers (and associated proportions) in WA are estimates only because TRA data is not available from Western Australia for 2020.
13. Denotes the estimated number of registered Aboriginal and Torres Strait Islander teachers nationally, incorporating imputed estimates for Western Australia. Multi-state registrations, based on wider workforce patterns, account for fewer than than 10 Aboriginal and Torres Strait Islander teacher registrations.
14. Retirement age is defined based on the age requirements for the Age Pension in Australia (Department of Social Services, 2023).
15. Percentages do not sum to 100% due to rounding.
16. CRTs differ from classroom teachers on the basis that they are qualified teachers employed to cover the temporary absences of permanent or fixed contract teaching staff (AITSL, 2021b).
17. Position in school is calculated based on the seniority level of the highest formal position reported by a registered teacher on the Australian Teacher Workforce Survey. CRTs are identified using contract type information.
18. Around 70% of schools in Australia are government schools (ACARA, 2023).
19. Combined schools provide education across multiple learner levels.
20. Wider teacher workforce – school type (2020): primary: 40%; secondary: 35%; combined: 15%; special: 3%.
21. Teachers report their place of employment in the Australian Teacher Workforce Survey. Where possible, the remoteness of the school or early learning centre in which the teacher is employed is identified using reference tables from either the Australian Curriculum, Assessment and Reporting Authority (ACARA) or the Australian Children’s Education & Care Quality Authority (ACECQA). Currently, between 24% and 32% of teachers’ place of employment are unable to be classified by remoteness, and have been excluded from this analysis. This proportion is expected to fall over time.
22. Remote and very remote areas were collapsed together due to sample size requirements.
23. Within their first 5 years in the profession.
24. Percentages do not sum to 100% due to rounding.
25. Includes both short fixed-term contracts (<1 year) and long fixed-term contracts (>1 year).
26. Wider teacher workforce – employment arrangements (2020): ongoing: 73%; fixed-term contract: 17%; CRT: 10%.
27. Percentages do not sum to 100% due to rounding.
28. Full-time equivalent (FTE) is calculated by dividing the number of hours worked by an employee by the number of hours in a full-time work week.
29. EBAs for government schools allot between 21.5 to 24 hours per week to face-to-face teaching, varying by state and territory.
30. This data covers schools only and excludes early childhood due to sample size.
31. All teachers – teacher duties (10+ hours) (2020): planning: 28%; student supervision: 11%; administrative tasks: 10%.
32. Across the wider teacher workforce from 2019–2020, lesson planning fell by 5 percentage points to 28% and administrative tasks fell by 2 percentage points to 10%.
33. During the uncertainty and pressures of the early stages of the COVID-19 pandemic in 2020, intentions to leave the profession dropped for the whole teacher workforce. Subsequent reporting from the ATWD has shown that this trend has since reversed, however data on the Aboriginal and Torres Strait Islander teacher workforce is only reported up to 2020 in this publication.
34. When asked in yes/no format, which differs from the ATWD, meaning results are not directly comparable.
35. Immediate (1 year or less) and short-term (2-4 years) plans are reported together due to sample size.
36. Due to cell size requirements, regional and remote data is compared from 2007 and 2018 rather than 2005 and 2019.
37. Indexed growth is calculated by dividing the number of commencements in a given year, t, by the number of commencements in the base year (2005) and multiplying by 100. Indexed growth provides a useful way of comparing trends over time between groups, on a common scale, when raw figures are too disparate.
38. 2005: 536 commencements; 2011: 643 commencements. 2005-11 change: +20%.
39. A Commonwealth Supported Place is a government subsidised place in a university course, which includes ITE programs. Students enrolled under a CSP do not pay for the full cost of a tertiary qualification, as the government pays for part of the tuition fees (Australian Government, 2023).
40. A supply-driven funding system allocates a quota of Commonwealth Supported Places to each public university each year, determined by the Australian Government under the Commonwealth Grant Scheme (Productivity Commission, 2019).
41. Population aged 15+ with a Bachelor degree – Aboriginal and Torres Strait Islander: 5.2%; National population: 18.2% (ABS, 2021a).
42. Multi-modal programs are offered through a combination of online and on-campus learning.
43. Online programs: 29%; multi-modal programs: 22%.
44. Online programs: 23%; multi-modal programs: 10%.
45. A two-year moving average has been applied to Aboriginal and Torres Strait Islander completions data due to low counts.
46. Population aged between 0 and 18 years of age.
47. ITE completions growth for all ITE students was 0.1% annually between 2005-2019, compared to 1.0% growth in the student-aged population (AITSL, 2023c).
48. Aboriginal and Torres Strait Islander population size data by age for is only available in census years, however, ABS projections show only small changes in the growth rate from year-to-year (ABS, 2019). This means that comparing 2005-2019 with 2006-2021 still provides a good indication of change in the size of the student-age population because the start and end years are close in time.
49. A cohort is the group of students who commenced an ITE program in a specific year. For example, the 2021 commencing cohort describes all new students who started ITE in 2021.
50. Postgraduate completion rate data for Aboriginal and Torres Strait Islander ITE students is only available from 2007 onwards, and a 2-year moving average has been applied due to low counts.
51. 2005 cohort: 21 percentage point difference between Aboriginal and Torres Strait Islander and non-Aboriginal and Torres Strait Islander six-year completion rates; 2014 cohort: 13 percentage point difference.
52. This assumes that Aboriginal and Torres Strait Islander ITE students also have lower completion rates in online programs, similar to the wider ITE student cohort.
53. All ITE students first-year attrition rate – 2019: 25%.