The key messages in this Spotlight reveal that:
- Nationwide, there are around 515,000 registered teachers and most (81%) are deployed in schools.
- Australian teachers and leaders work in a variety of contexts in almost 10,000 schools across the country.
- The teacher workforce is highly experienced. In 2022, 27% had been in the profession for 10-19 years while 14% of the workforce were early career teachers (within their first 5 years).
- Leadership roles become increasingly common with more years’ experience – transitions into middle leadership positions typically occur at the 10-19-year mark and senior leader positions are more often held after 20-29 years.
- Teachers are increasingly employed under ongoing/permanent contracts, while the prevalence of short-term contracts has declined, and full-time employment has become more common over time.
- Across all industries in Australia, a considerable proportion of workers are reporting that they are considering leaving their current jobs. Job mobility is up – in the 12 months prior to February 2022, 9.5% of all employed Australians
changed jobs, the highest rate since 2012. Workers are also reporting high levels of burnout.
- The teacher workforce is not immune from this broader phenomenon. In 2022, 5% of the teacher workforce reported an intention to leave the profession within the next year. Overall, 35% intend to leave before retirement and this has increased
over time, up from 26% in 2019.
- Though the proportion of the teacher workforce who report their intention to remain until retirement has declined in recent years (from a high of 46% in 2020 to 31% in 2022) more than a third (35%) are unsure of their career intentions. A
further 8% are unsure of exactly how long they will remain in the profession before leaving. This indicates there is considerable scope for retention strategies to have a positive impact.
- The top three factors influencing teachers’ intentions to leave the profession before retirement have remained consistent over time – workload and coping; recognition and reward; and classroom factors.
Teachers play a pivotal role in our education system. Their expertise, dedication and commitment are fundamental to the education of the next generation of Australians. Given the current teacher shortage, it is particularly important that the characteristics
and qualities of the teacher workforce are understood and celebrated, while the pressures teachers face are examined and acknowledged to find ways to support the profession.
All Australian governments have committed to addressing the challenges facing the teaching profession and ensuring a sustainable and thriving workforce. Agreed by all Education Ministers in December 2022, the National Teacher Workforce Action Plan provides a roadmap for transformative changes in the recruitment, training, and support of teachers (Department of Education, 2022). It outlines strategic priorities and initiatives aimed
at attracting more people into the teaching profession, providing comprehensive induction and mentoring programs, and supporting teacher retention. The Action Plan also commits to improving data and information available for workforce planning
to provide a more comprehensive understanding of current and future workforce needs. The Australian Teacher Workforce Data (ATWD) initiative, supported
by all governments, systems and sectors, can drive improvements in the quality and availability of workforce information to support workforce planning.
In addition to this ongoing and future work, the ATWD already provides rich data and insights into the teaching profession. This Spotlight provides a snapshot overview of the current teacher workforce in Australia by drawing on data released through
the ATWD Key Metrics Dashboard, including the demographics, qualifications and characteristics of Australian teachers, their
workforce experiences, and the challenges faced by the teacher workforce in 2022.
By exploring factors such as contract types, working hours, teacher and leader duties, and workforce pressures, this Spotlight provides valuable insights to support policymakers in school systems and sectors, school leaders, and educators in their
decision-making processes, ultimately enhancing the quality of teaching and learning experiences in Australia. As we navigate the evolving landscape of education, it is essential to leverage data-driven approaches to drive positive change and
strengthen the teaching profession for the benefit of both teachers and students.
Australian Teacher Workforce Data (ATWD) Key Metrics Dashboard
The ATWD Key Metrics Dashboard provides digital access to longitudinal trend data from the Australian Teacher Workforce Data (ATWD) initiative. The ATWD Key Metrics Dashboard provides the characteristics of teacher supply and the experiences of
teachers across Australia, including: who they are, where they work, and what critical workforce issues concern current and future teachers. This will support workforce modelling and planning and help to identify and address critical issues.
You can find out more here: https://www.aitsl.edu.au/research/australian-teacher-workforce-data/key-metrics-dashboard
In 2020, the ATWD estimated that nationally there are around 515,000[1] registered teachers. The ATWD is unique because it comprises data about all registered teachers
deployed across schools and early learning centres, including casual/relief teachers, as well as those not currently working as teachers. Given this, the ATWD’s estimate is higher than figures provided by both the Australian Curriculum,
Assessment and Reporting Authority (ACARA) and the Australian Bureau of Statistics (ABS).
Most teachers register to work in one state or territory only (97%, n=450,508, in 2020). Of those in a single jurisdiction, New South Wales (NSW) had the highest number of registered teachers in 2020 (n=170,353), followed by Victoria (n=119,606) and
Queensland (n=104,131). Northern Territory (NT, 29.5%, n=1,667) and Australian Capital Territory (ACT, 15.1%, n=1,283) had the highest proportion of teachers registered across multiple jurisdictions (Figure 1).
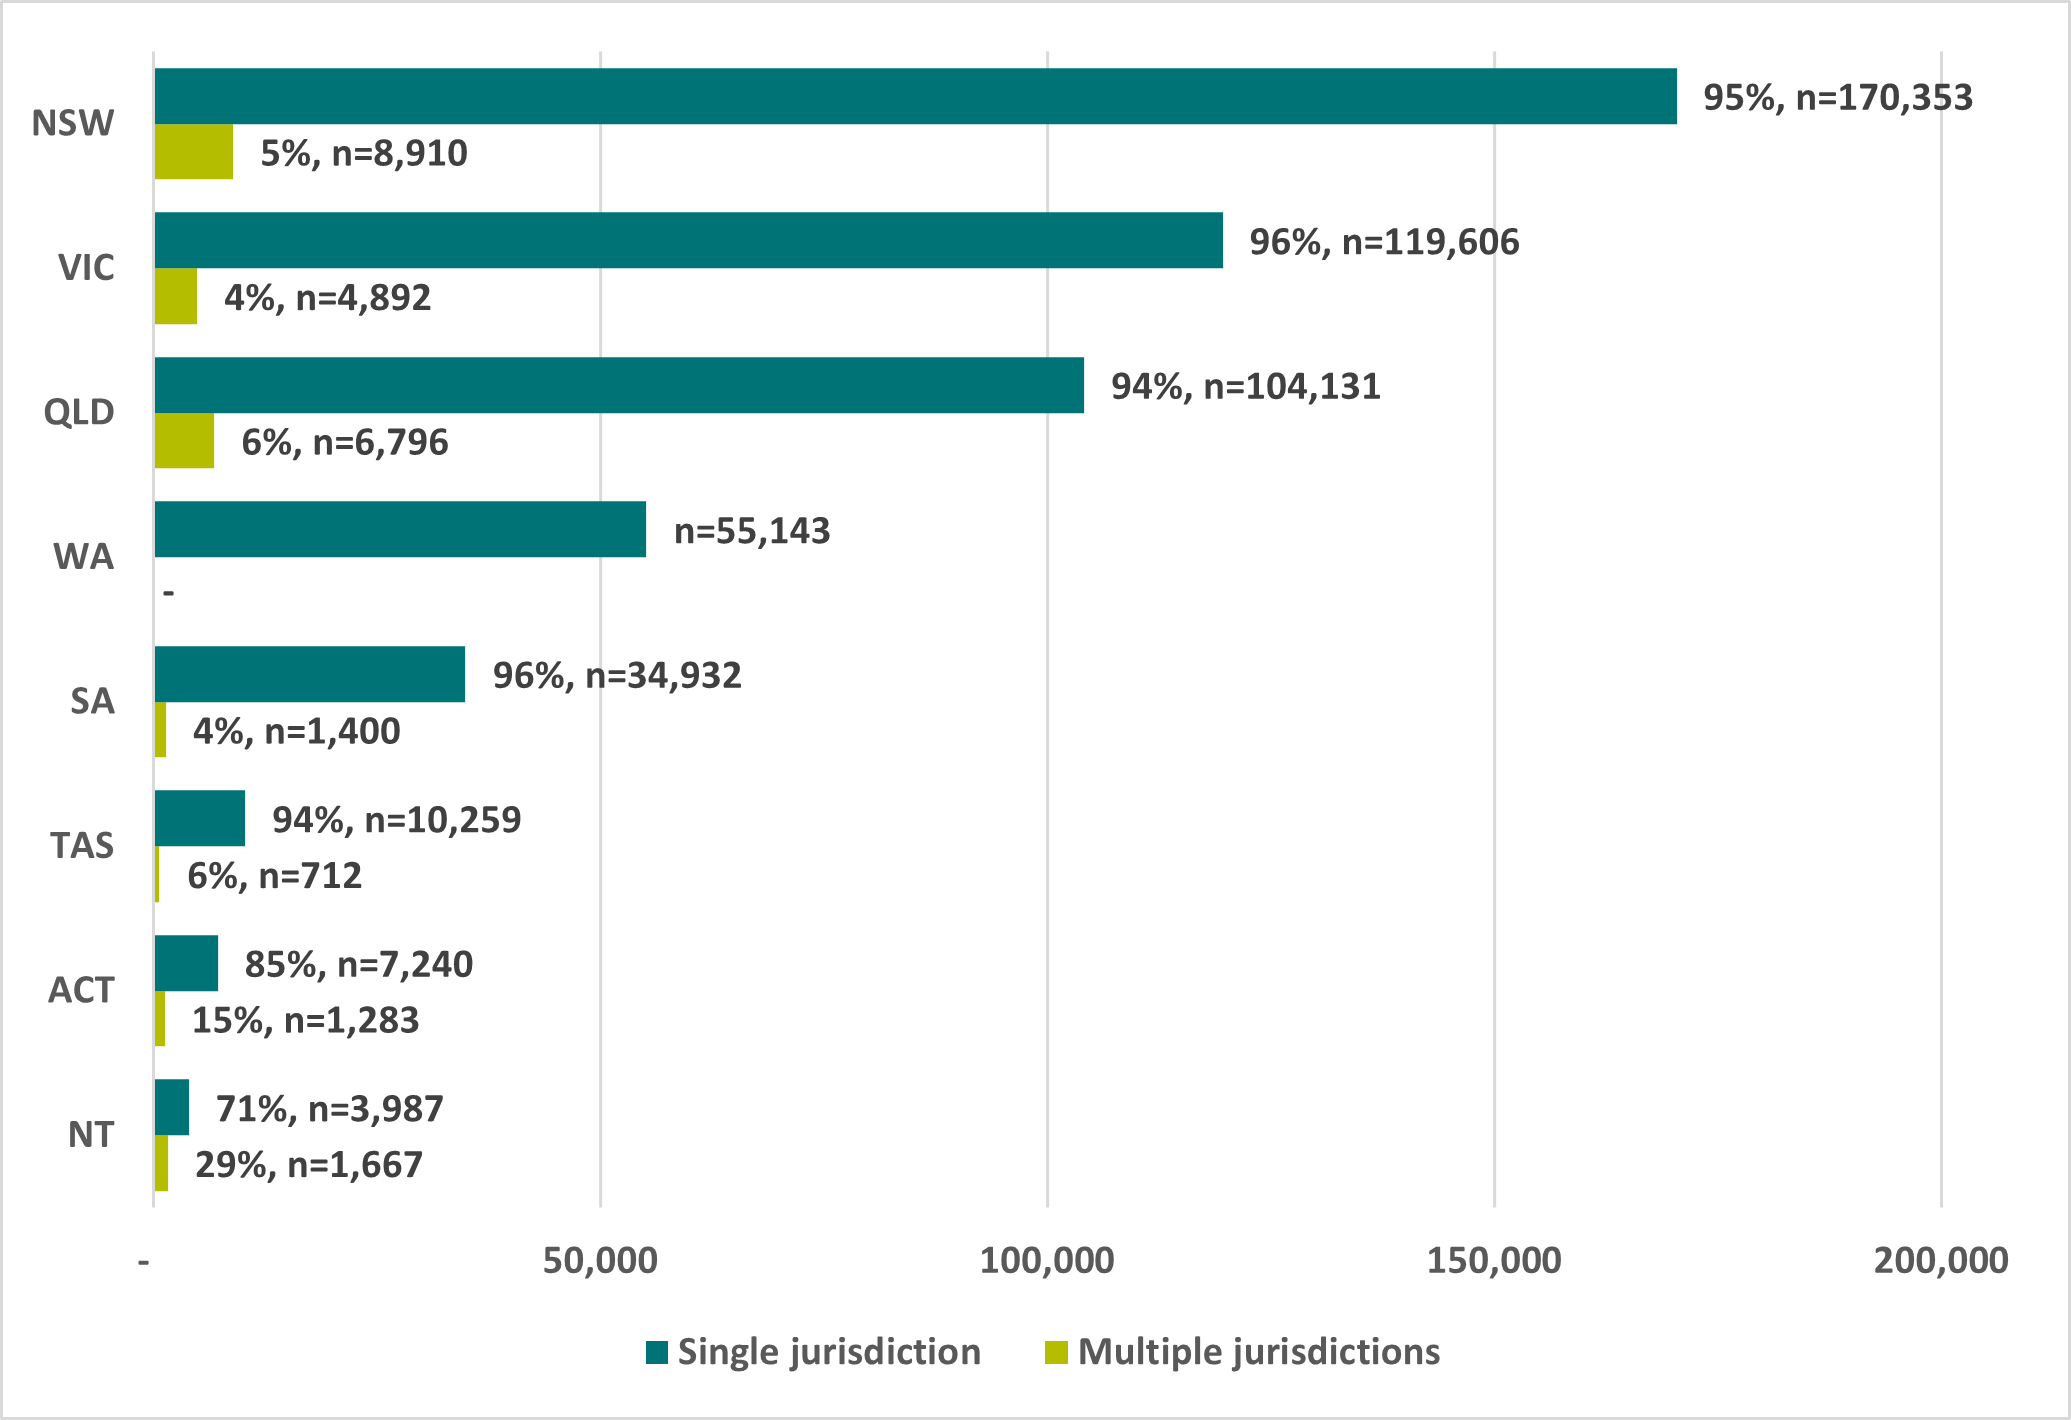 Figure 1: Number of registered teachers in ATWD participating jurisdictions, 2020
 Overall , in 2020, most Australian teachers were women (76%), born in Australia (83%) and aged 30-59 (70%).[2]
In 2020, 24% of registered teachers were aged over 60, and therefore approaching retirement age. A majority of the workforce were aged 40-59 (53%). Around a quarter (24%) of all registered teachers had been registered less than 5 years, while most
(58%) had held registration for ten years or more.
The teaching profession is heavily women-dominated – in 2020, less than a quarter (24%) of registered teachers were men. Notably, women continue to be under-represented in senior leadership positions. Women comprised 76% of the teacher workforce
in 2020, however, 69% of senior leaders were women. This trend shows no sign of changing; rather the gap has increased over time. In 2018, 71% of senior leaders were women but the broader gender makeup of the workforce has not shifted to account
for the 2-percentage point drop to 69% in 2020.
Most registered teachers are born in Australia, and this has not changed in recent years – in 2020, 17% were born overseas.
Australia’s schools
There are notable geographical, sectoral and jurisdictional differences in education settings across Australia, which means Australian teachers work in a range of contexts. From metropolitan areas to remote communities, each region presents unique
challenges and opportunities for education. It is essential for policymakers and education stakeholders to understand the diverse schooling contexts and the teaching workforce in these contexts to develop inclusive and responsive policies that
address the specific needs and circumstances of schools in various locations.
The ACARA School Profile (ACARA, 2023) indicates that there are 9,709 schools across Australia. A third (n=3,183)
are in NSW and a quarter (24%, n=2,296) are in Victoria. There are 194 (2%) schools in the Northern Territory and 137 (1%) in the ACT.
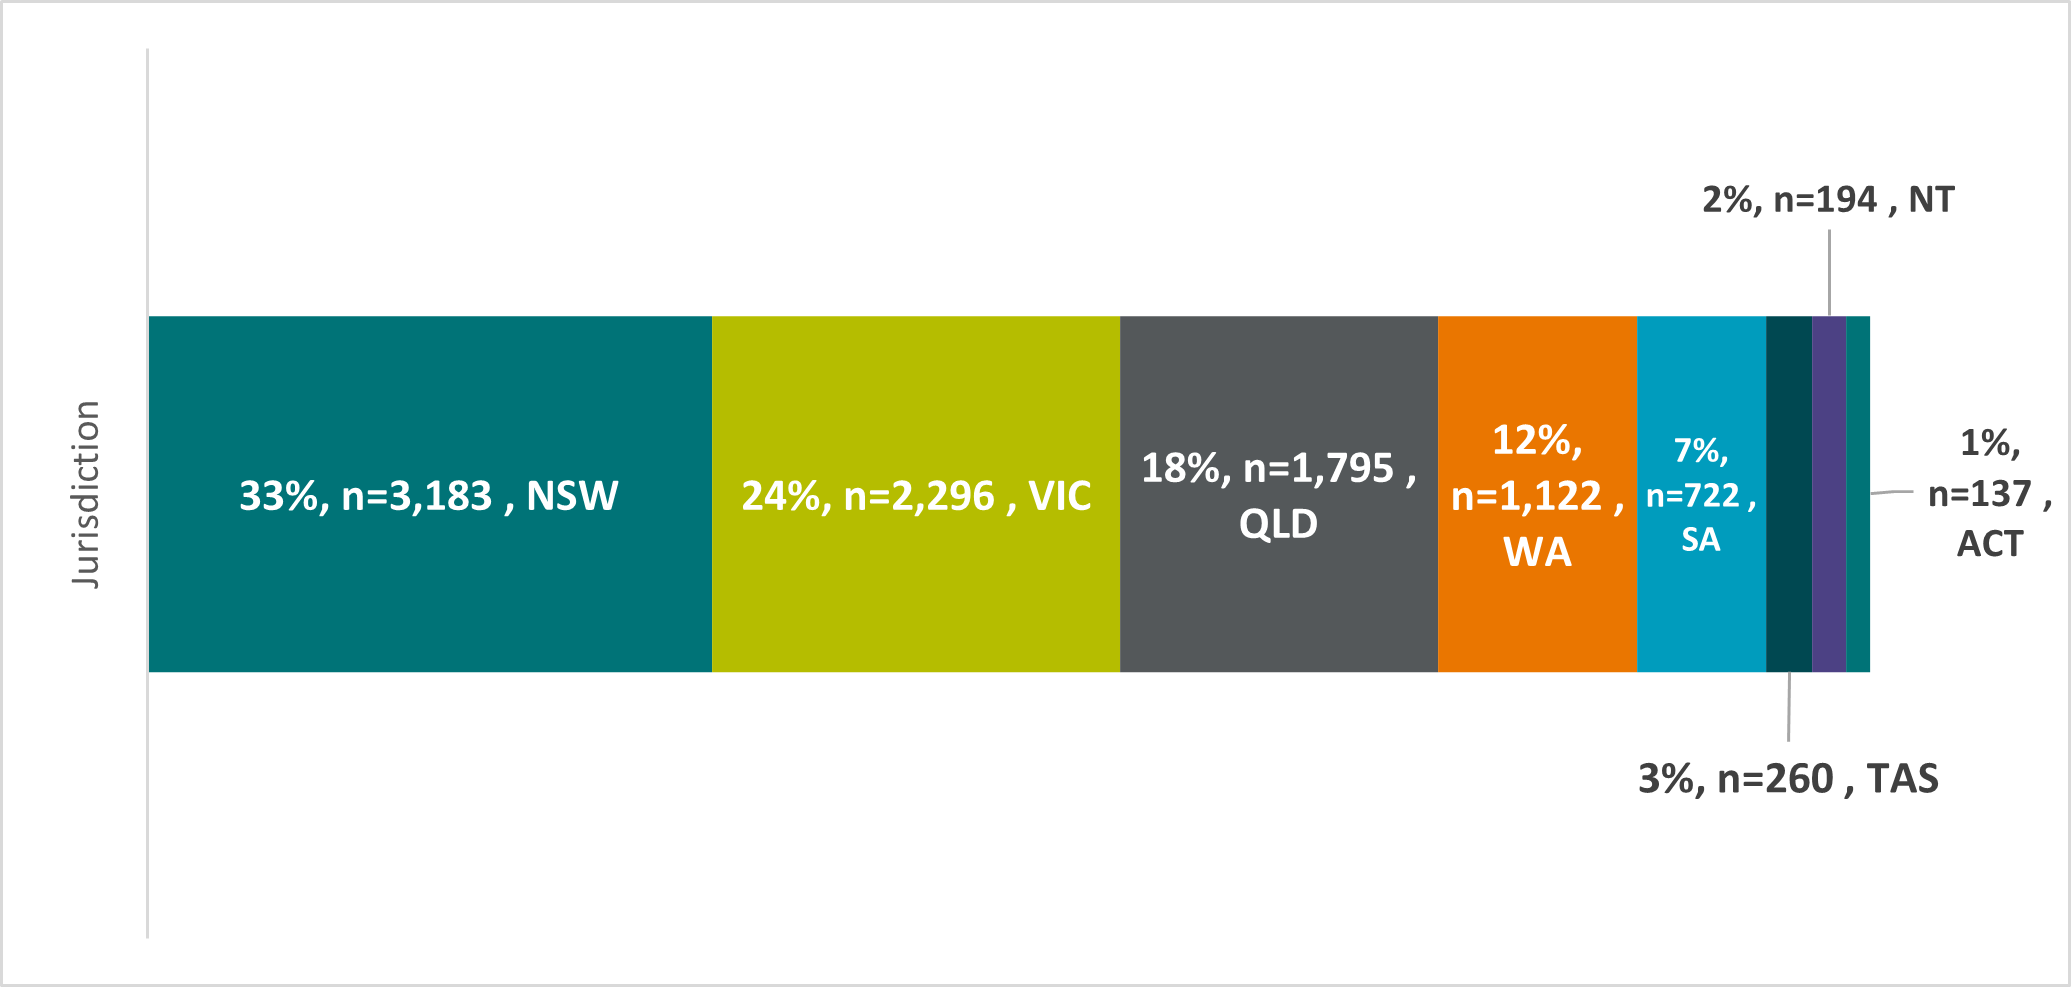 Figure 3: Australia schools by jurisdiction, 2022
More than half of all schools in Australia are in metropolitan areas (54%, n=5,291) and around 6% (n=601) are in remote or very remote locations.
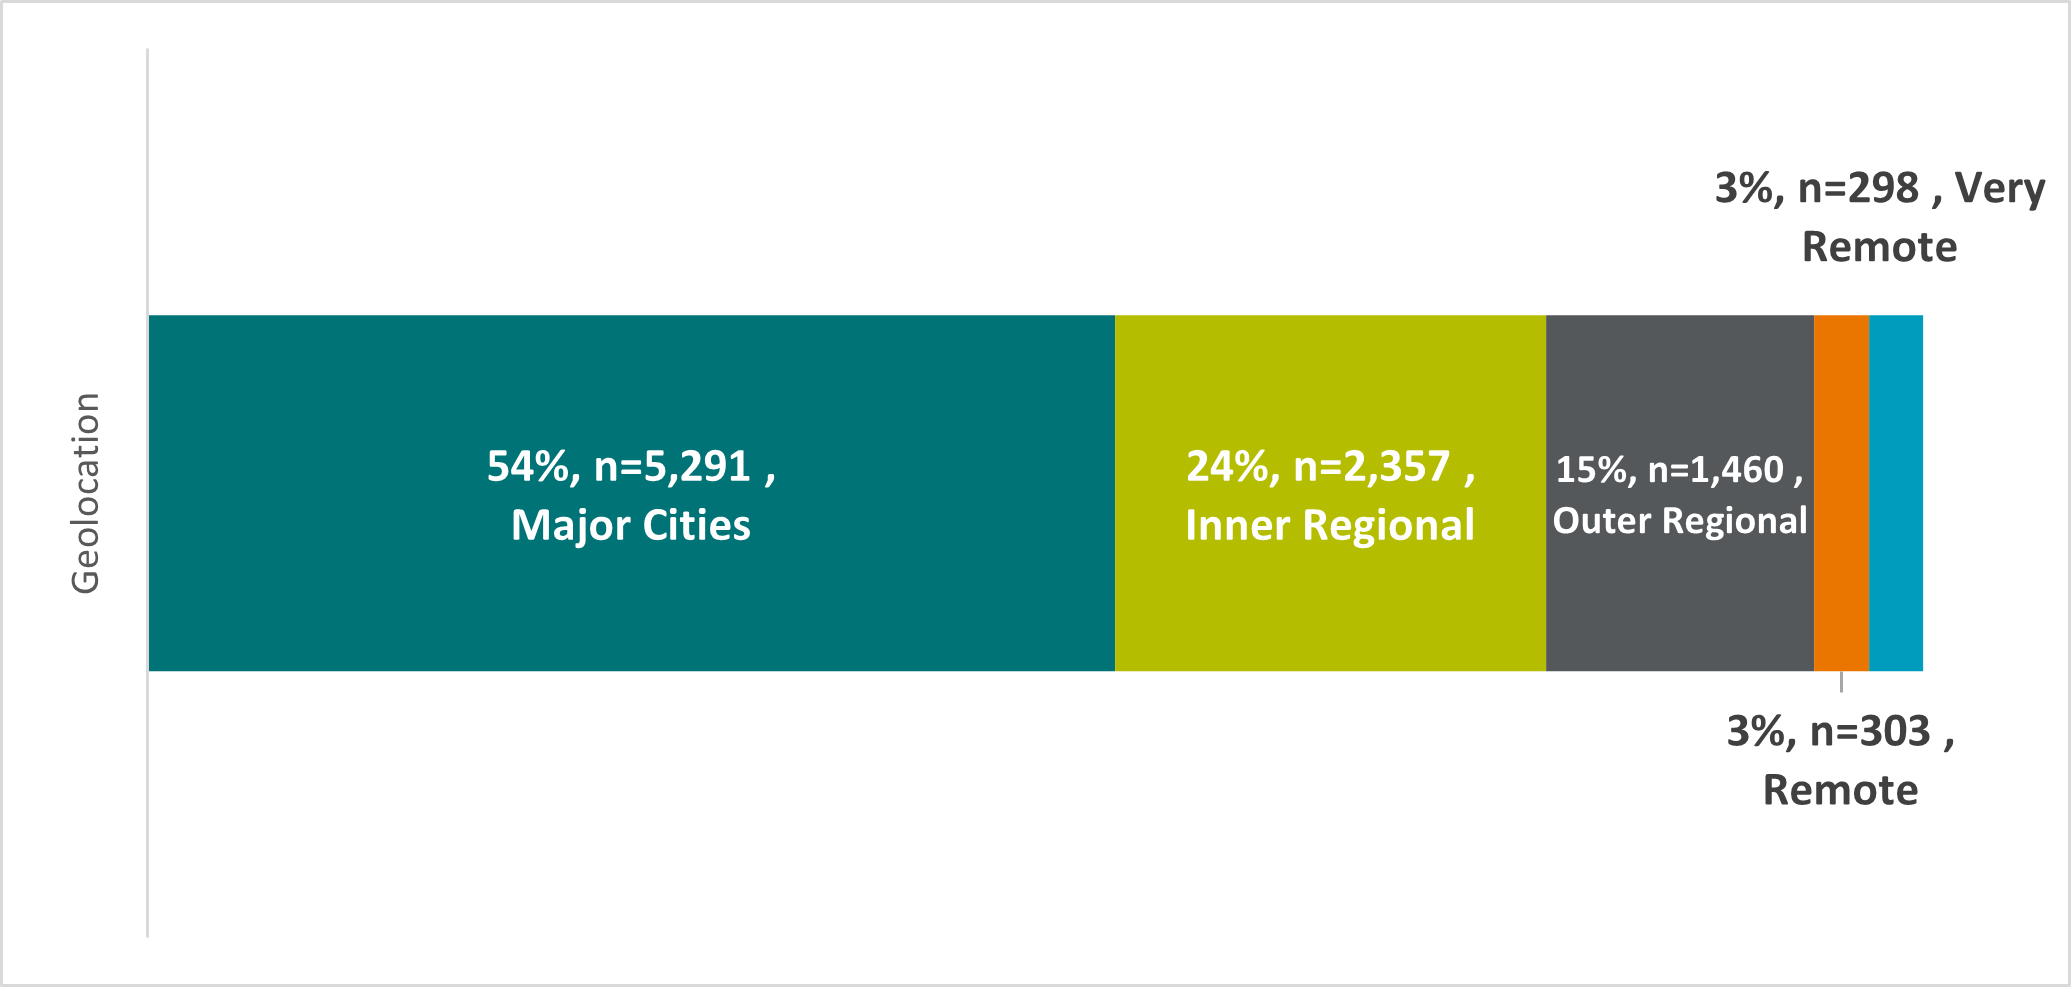 Figure 4: Australian schools by geolocation, 2022
There are notable differences between Australian schools in terms of staff numbers. On average, schools in major cities have more teaching staff than in less populated areas (average of 46 teaching staff in major cities). With increasing remoteness, this
average drops from 27 in inner regional areas to 20 in outer regional areas; 15 in remote and 11 in very remote areas.
At the national level, 22% (2,148) of all schools have ten or fewer staff, 21% (n=2,000) have between ten and twenty teaching staff and around a fifth have more than 50 teaching staff (21%, n=2,070). With increasing remoteness, the number of teaching
staff in schools declines as the number of student enrolments also drops. As shown in Figure 6, whereas major cities are more likely to have schools with larger numbers of teaching staff, two-thirds of very remote schools have ten or fewer teachers.
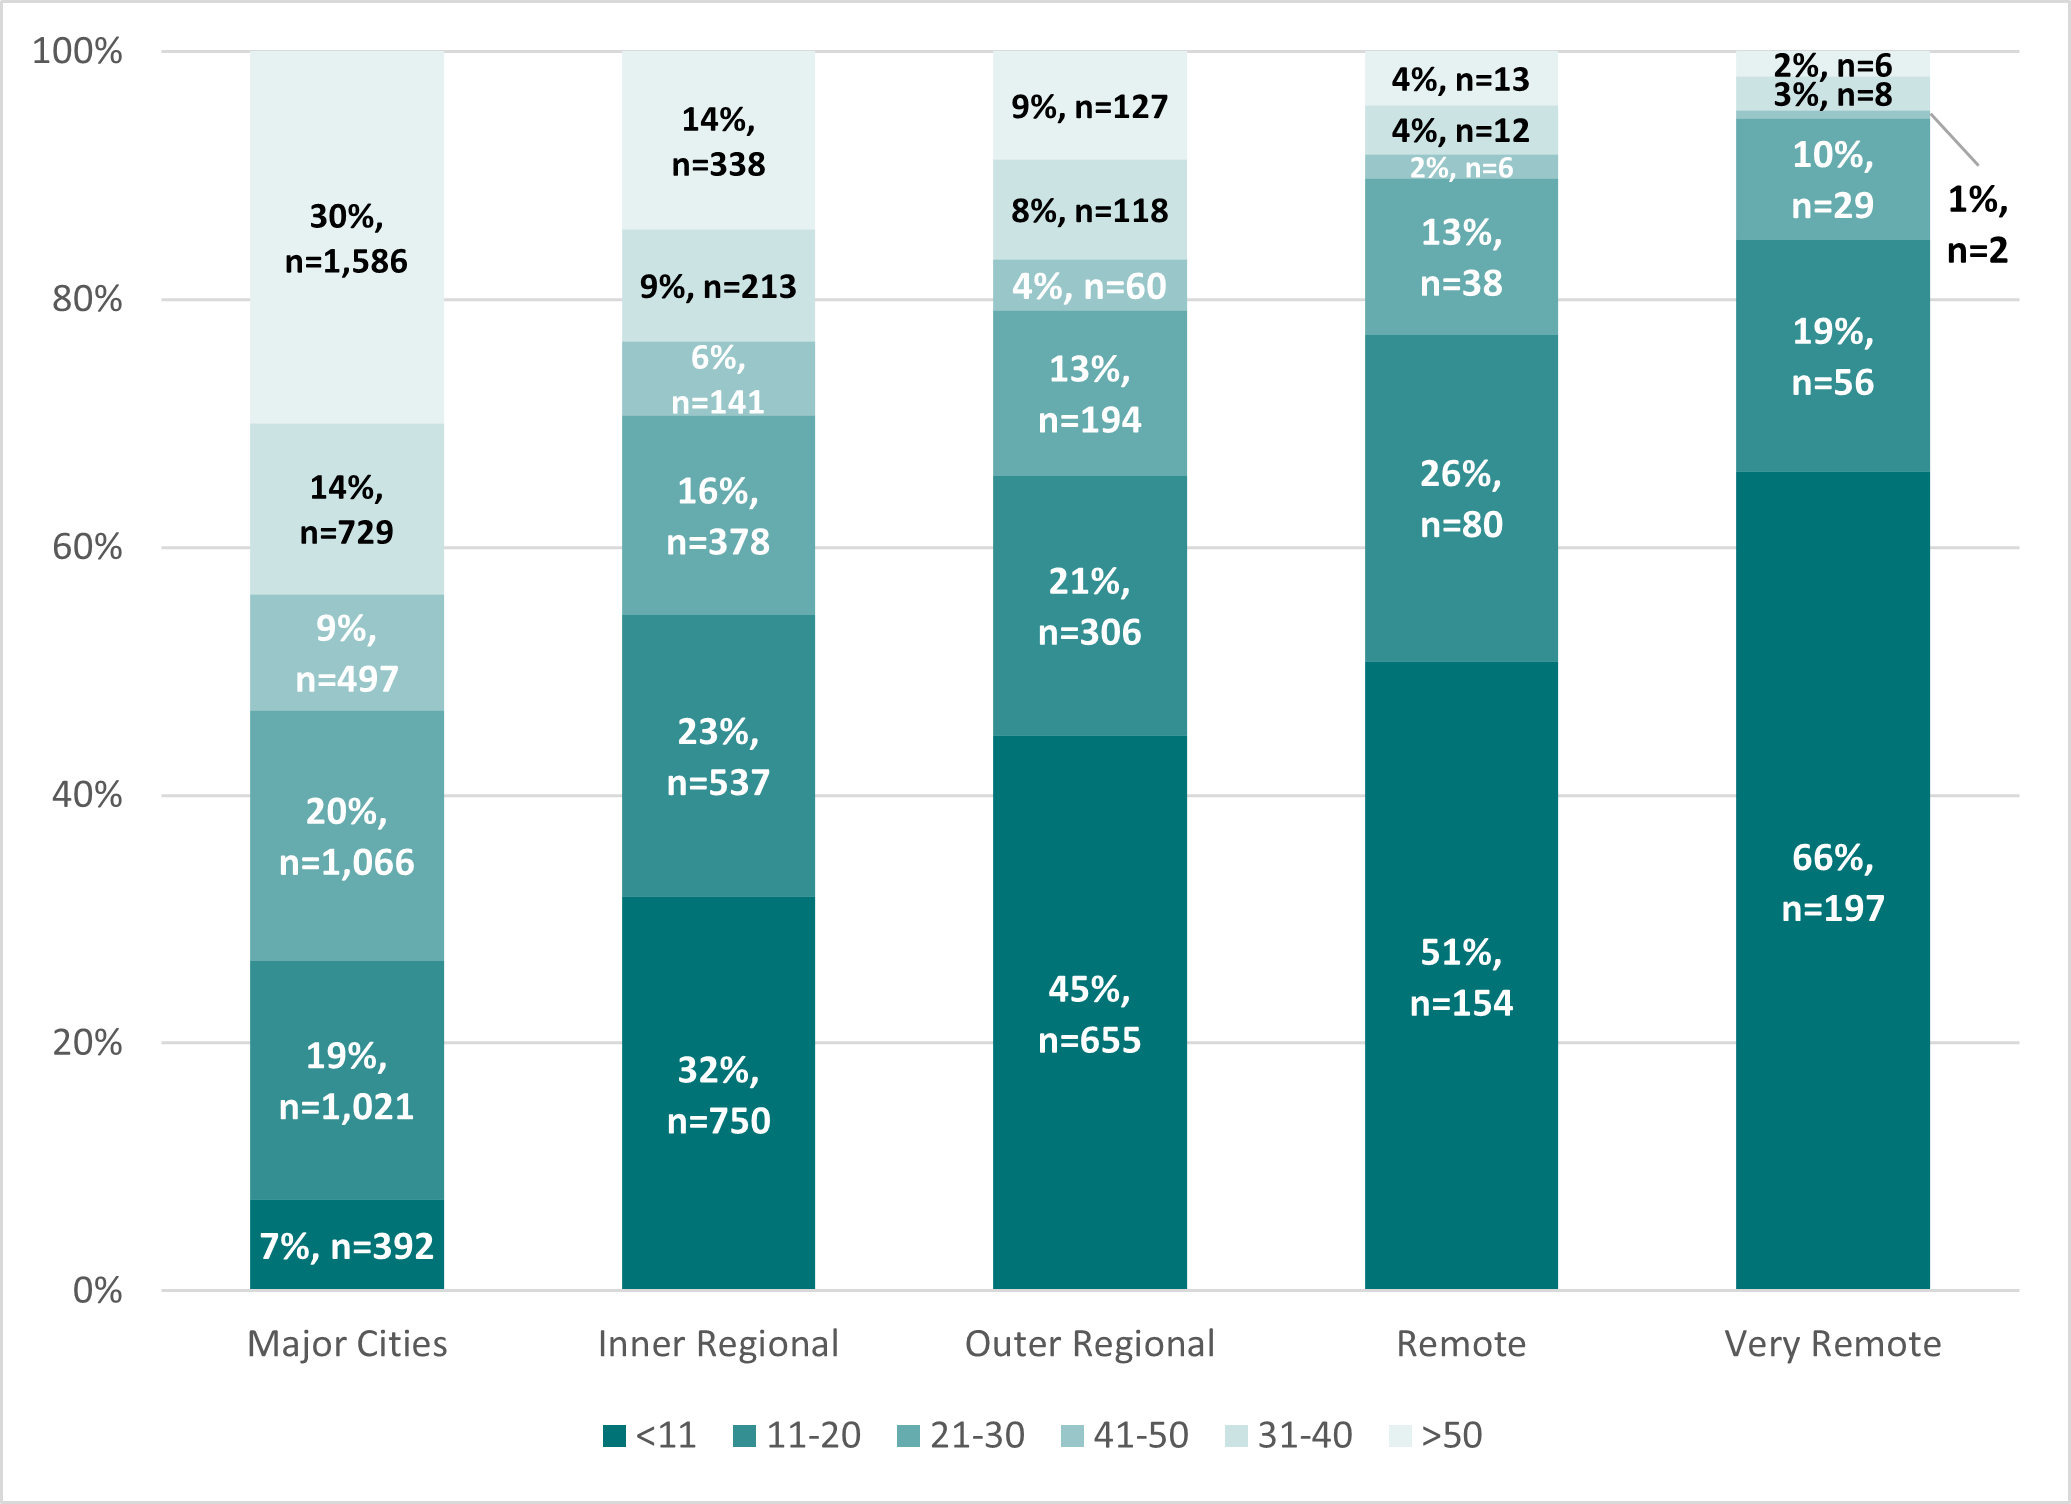 Figure 5: Australian schools by number of teaching staff and geolocation, 2022
While most schools are in the Government sector (70%, 6775), 18% (n=1,705) are Catholic and 13% (n=1,229) are Independent. Nearly two thirds of all schools are primary schools (64%, n=6,220). There are 1,506 (16%) secondary schools, 1,443 (15%) combined
schools and 540 (6%) special schools. The distribution of school type varies by geolocation. As shown in Figure 6, combined schools become more common with increasing remoteness.
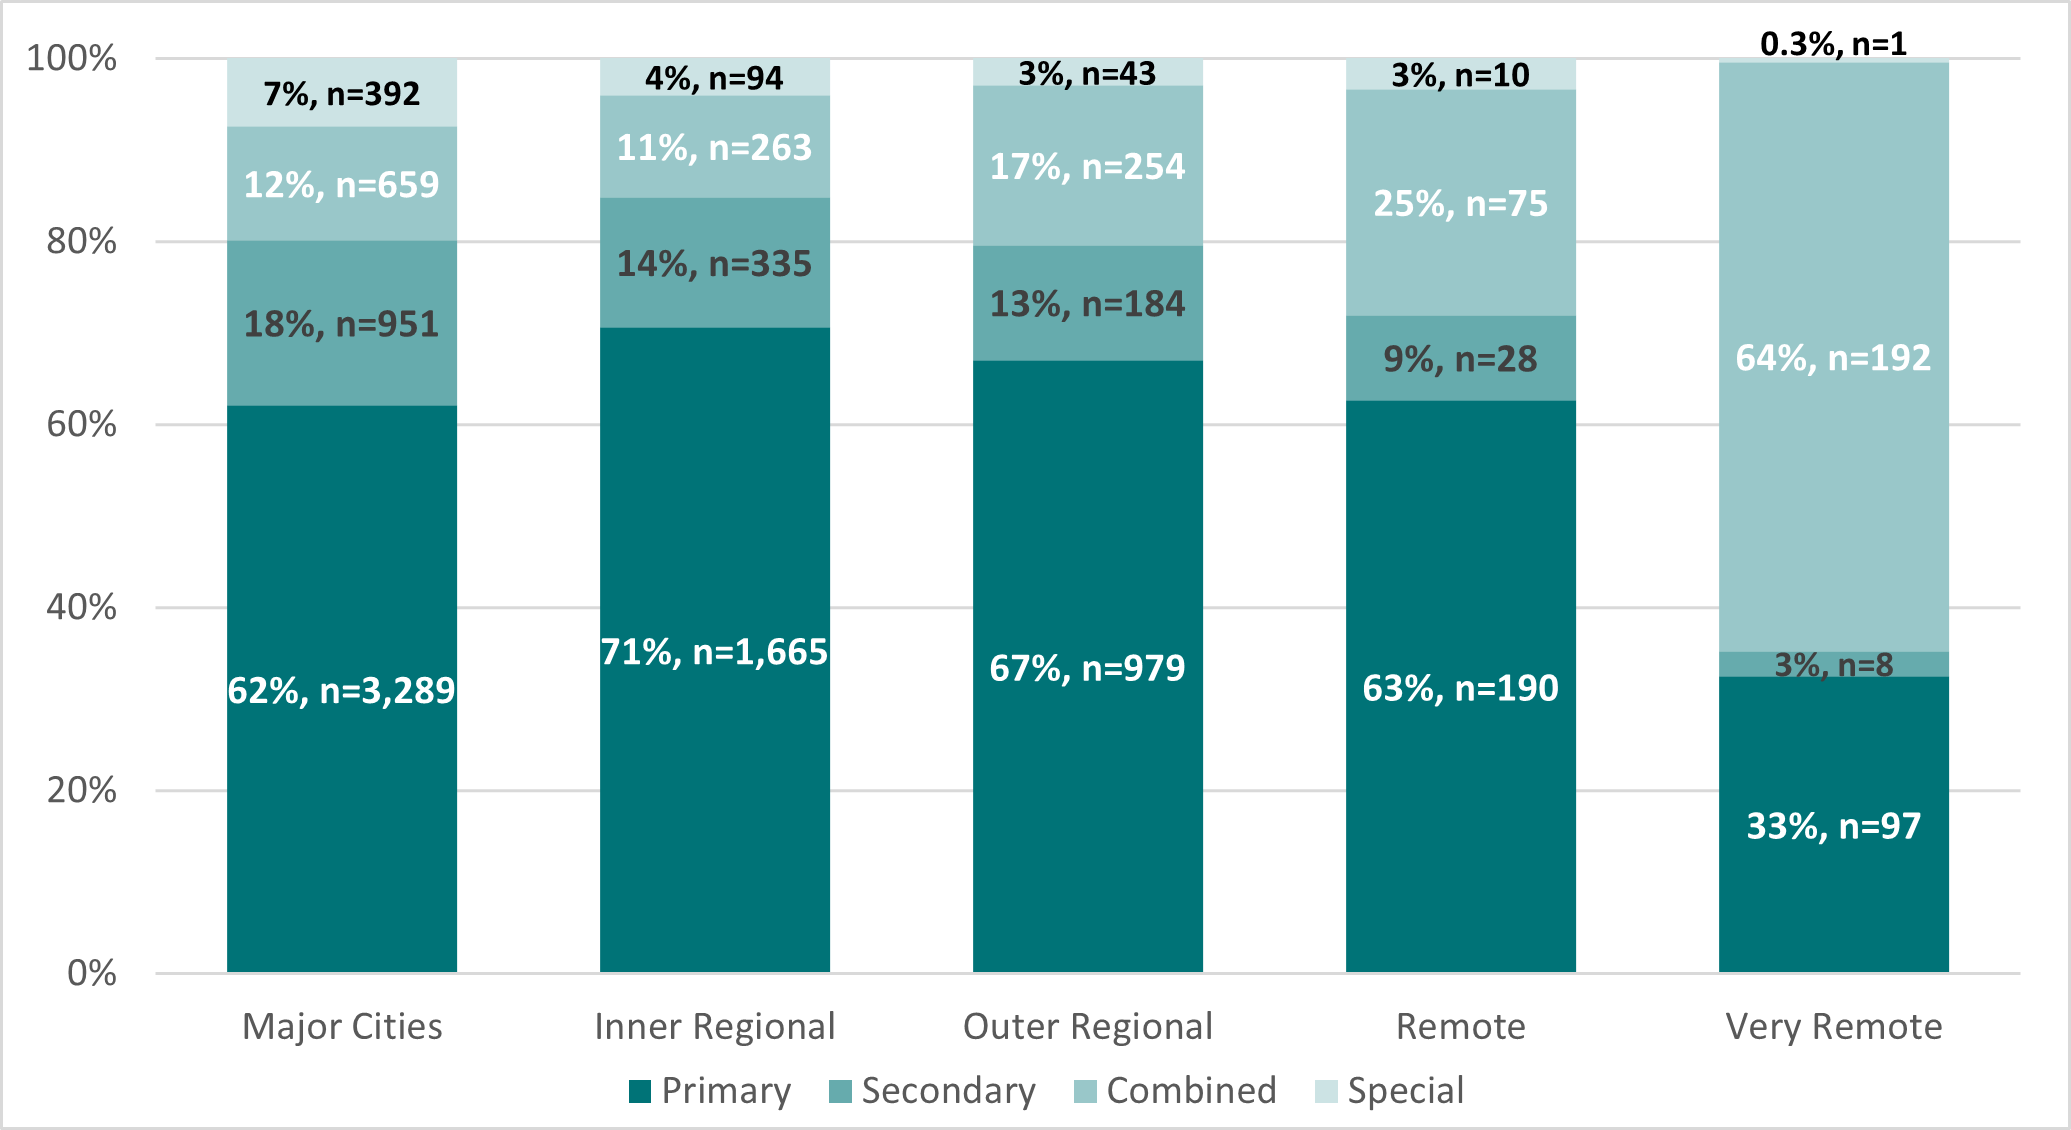 Figure 6: Australian schools by school type and geolocation, 2022
These data demonstrate that Australian schools operate in a variety of contexts, which in turn influence both the educational experiences of students and the workforce experiences of teachers and school leaders. Policies that acknowledge and respond to
these diverse schooling contexts can contribute to equitable access, improved educational outcomes, and enriched experiences for students and teaching staff across the country.
Findings from the Australian Teacher Workforce Survey provide rich insights into how Australia’s teacher workforce operates, including where they are deployed, what roles teachers and school leaders hold in schools, their contractual arrangements,
and their years of experience. This section summarises recent results of the Australian Teacher Workforce Survey to provide a snapshot of workforce characteristics for teachers and leaders at both national and jurisdictional levels.
The Australian Teacher Workforce Survey (formerly the ATWD Teacher Survey) provides an opportunity for all Australian teachers to share their experiences and insights – all registered teachers are invited to participate (through their teacher
regulatory authority). Given all registered teachers have the opportunity to participate in the survey, and response bias analyses have shown the survey is representative (AITSL, 2021), the Australian Teacher Workforce Survey provides the best
available data on the experiences of the teacher workforce. Participation in the Australian Teacher Workforce Survey has grown from 13,529 completions in 2018 to 38,415 complete responses in 2022[3].
This makes it the largest national survey of teacher workforce experiences in Australia and offers strong evidence for trends in teacher deployment and workforce characteristics.
Find out more here: https://www.aitsl.edu.au/research/australian-teacher-workforce-data/australian-teacher-workforce-survey
Most registered teachers are deployed in schools (81%) and 4% are deployed in an early learning centre (ELC). Those not deployed in a school/ELC (9%) and those on an extended leave of absence (6%) comprise the non-teacher workforce (15%) within the cohort
of registered teachers (Figure 7). The proportional breakdown of the registered teacher workforce, by school type, learner level taught, and role type is shown in Figure 7. Though 64% of all Australian schools are primary schools, as shown in Figure
7 the teacher workforce deployed in schools is relatively evenly split between primary (32%) and secondary (34%) learners.
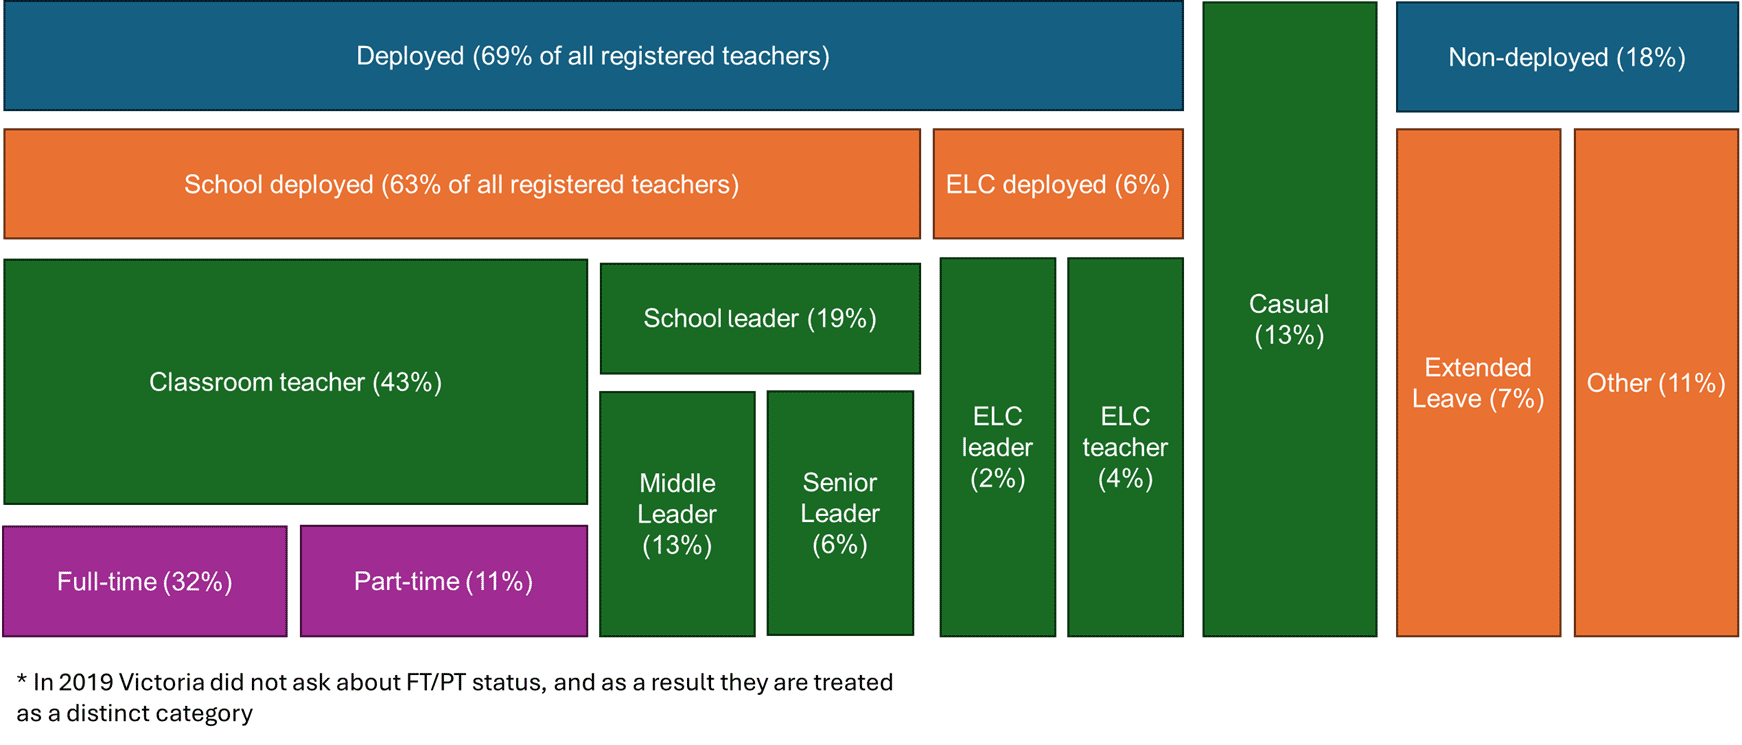 Figure 7: Proportional structure of the registered teacher workforce by segment[4], 2022 (AITSL, 2023)
Nationwide, classroom teachers[5] account for 61% of the teacher workforce deployed in schools[6] or early childhood settings, followed by middle leaders[7] at 19%, senior leaders[8] at 10% and casual/relief teachers at 10%. Workforce deployment varies somewhat by jurisdiction, for example Victoria has a higher proportion of middle leaders (27% in 2022) than the national figure (19%) and NSW has a higher proportion of senior leaders
(15% in 2022). In comparison to the national figure of 10%, in South Australia a higher proportion of the workforce are casual/relief teachers (CRTs) (14% in 2022) whereas in Western Australia (8%) and the NT (8%) a smaller proportion of the workforce
are CRTs.
In 2022, 14% of the teacher workforce were early career teachers (5 years or fewer in the profession) and 12% had 6-9 years’ experience. A large proportion had been in the profession for 10-19 years (27%) or 20-29 years (20%). A notable proportion
of teachers (11% of the workforce) had 40 or more years’ experience in the profession.
When the different positions in schools are examined by number of years in the profession, interesting insights emerge into the distribution of positions over time (Figure 8). Senior leaders and middle leaders tend to have more years in the profession
than classroom teachers. For example, in 2022, 35% of middle leaders and 27% of senior leaders reported 10-19 years in the profession. Most senior leaders (68%) have 20 or more years in the profession. For classroom teachers, there is greater variability
in experience. In 2022, a fifth (20%) of classroom teachers were early career (within their first 5 years) and only 6% reported 40 or more years in the profession. In contrast, a large proportion of CRTs (28%) were among the most experienced registered
teachers (40+ years in the profession).
Given that only 11% of the total workforce report 40 or more years’ experience, this indicates highly experienced teachers who are approaching or have entered retirement are over-represented in the pool of CRTs. This could be due to the appeal of
casual/relief teaching for those who no longer wish to work full-time, or it could also indicate a difficulty in finding permanent positions for those with many years’ experience. The proportion of CRTs with 40 or more years’ experience
was even higher during the COVID-19 pandemic (31% in 2020; 32% in 2021). This may indicate highly experienced teachers remained in the profession (or returned from retirement) during the height of the pandemic when pressure on the workforce was exacerbated
due to various lockdowns and absences due to illness (some employers also encouraged inactive teachers to re-join the workforce during this period).
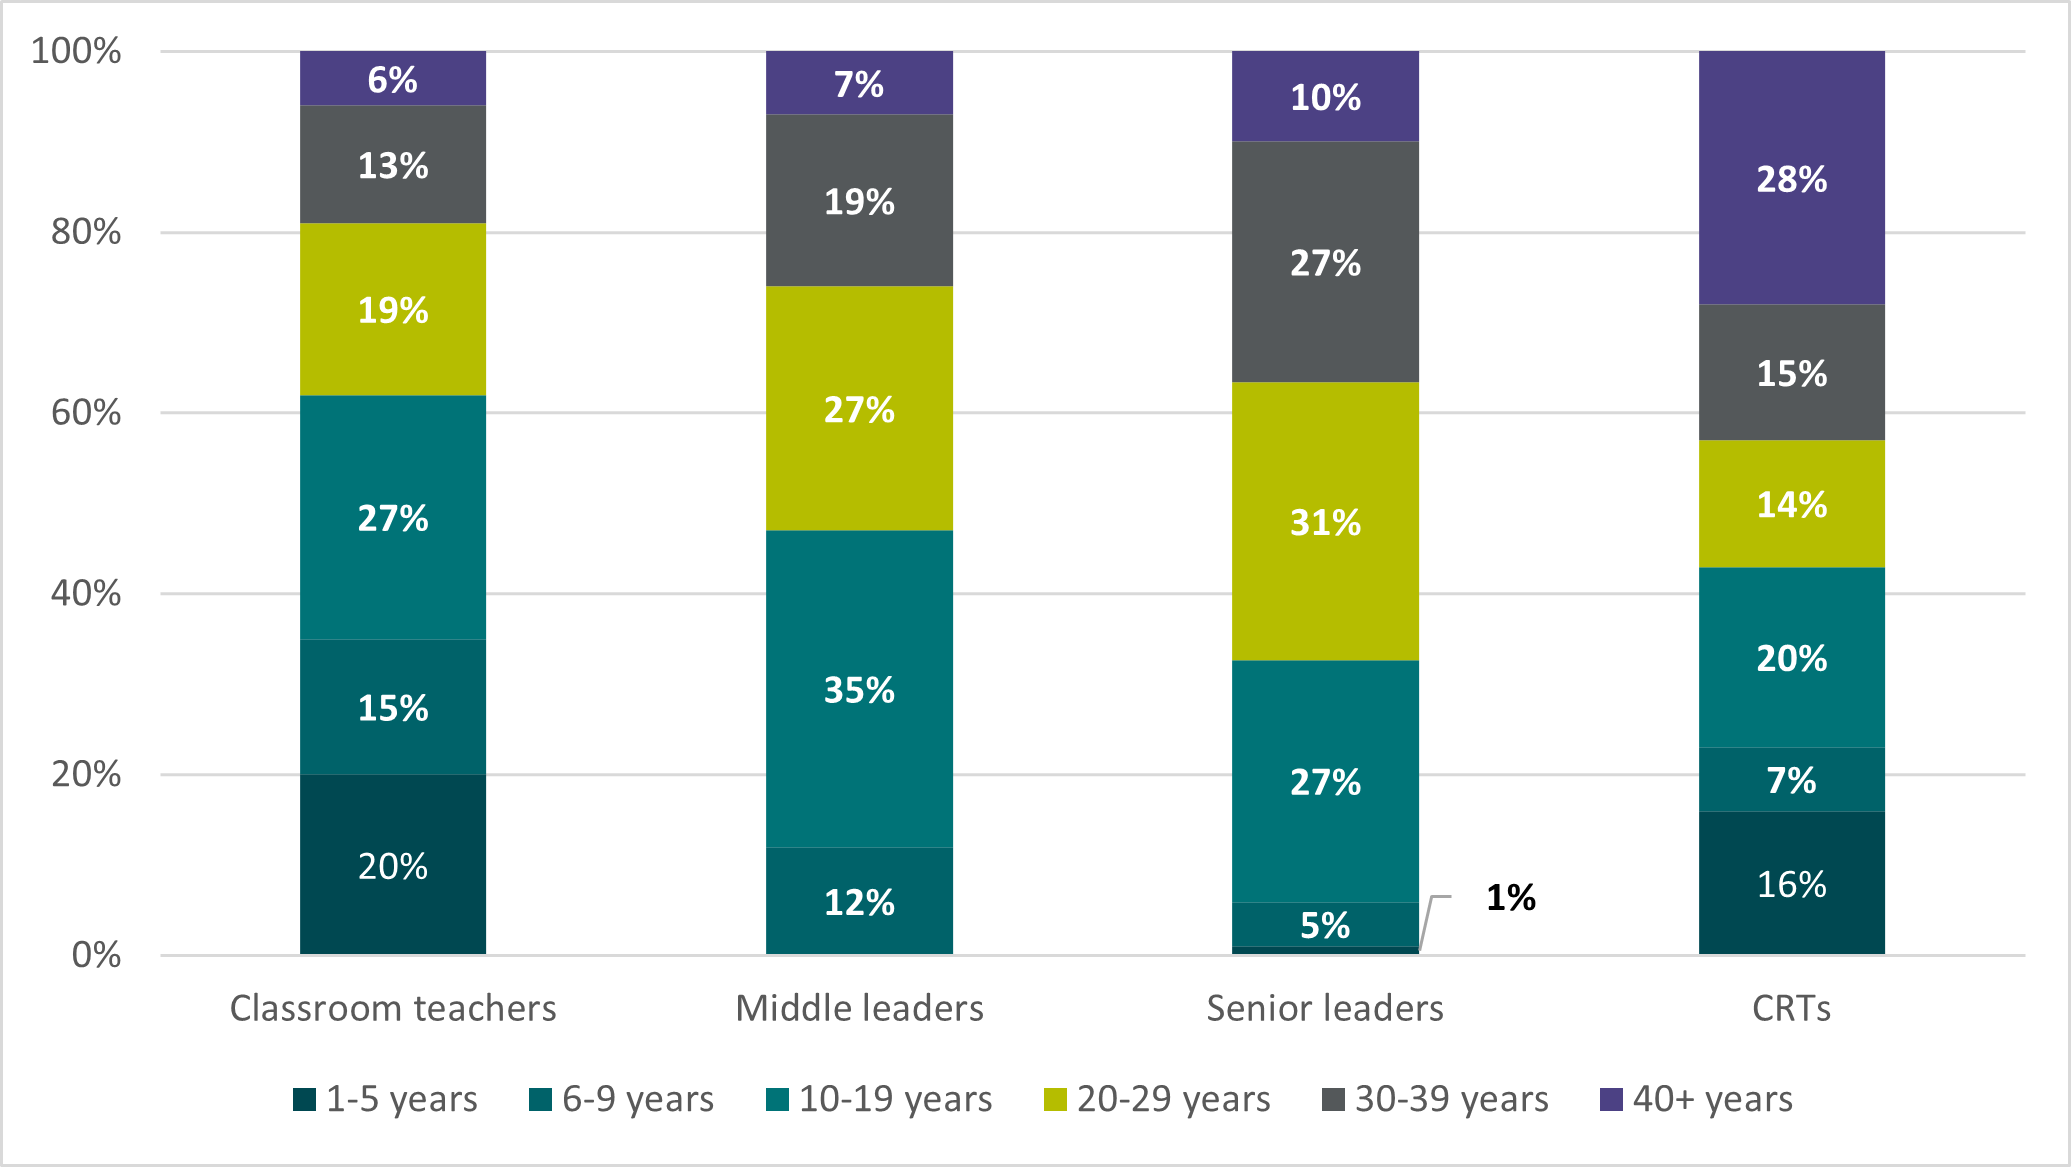 Figure 8: Position in school, by years in the profession, 2022
To further illustrate the emergence of leadership roles with increasing years’ experience, Figure 9 plots the proportion of the permanent (non-CRT) teacher workforce over years in the profession, by position. This demonstrates that with increasing
experience, leadership positions constitute larger proportions of the workforce. Middle leadership roles appear to emerge for teachers with 6-19 years in the profession and senior leader roles become increasingly available after 20 years.
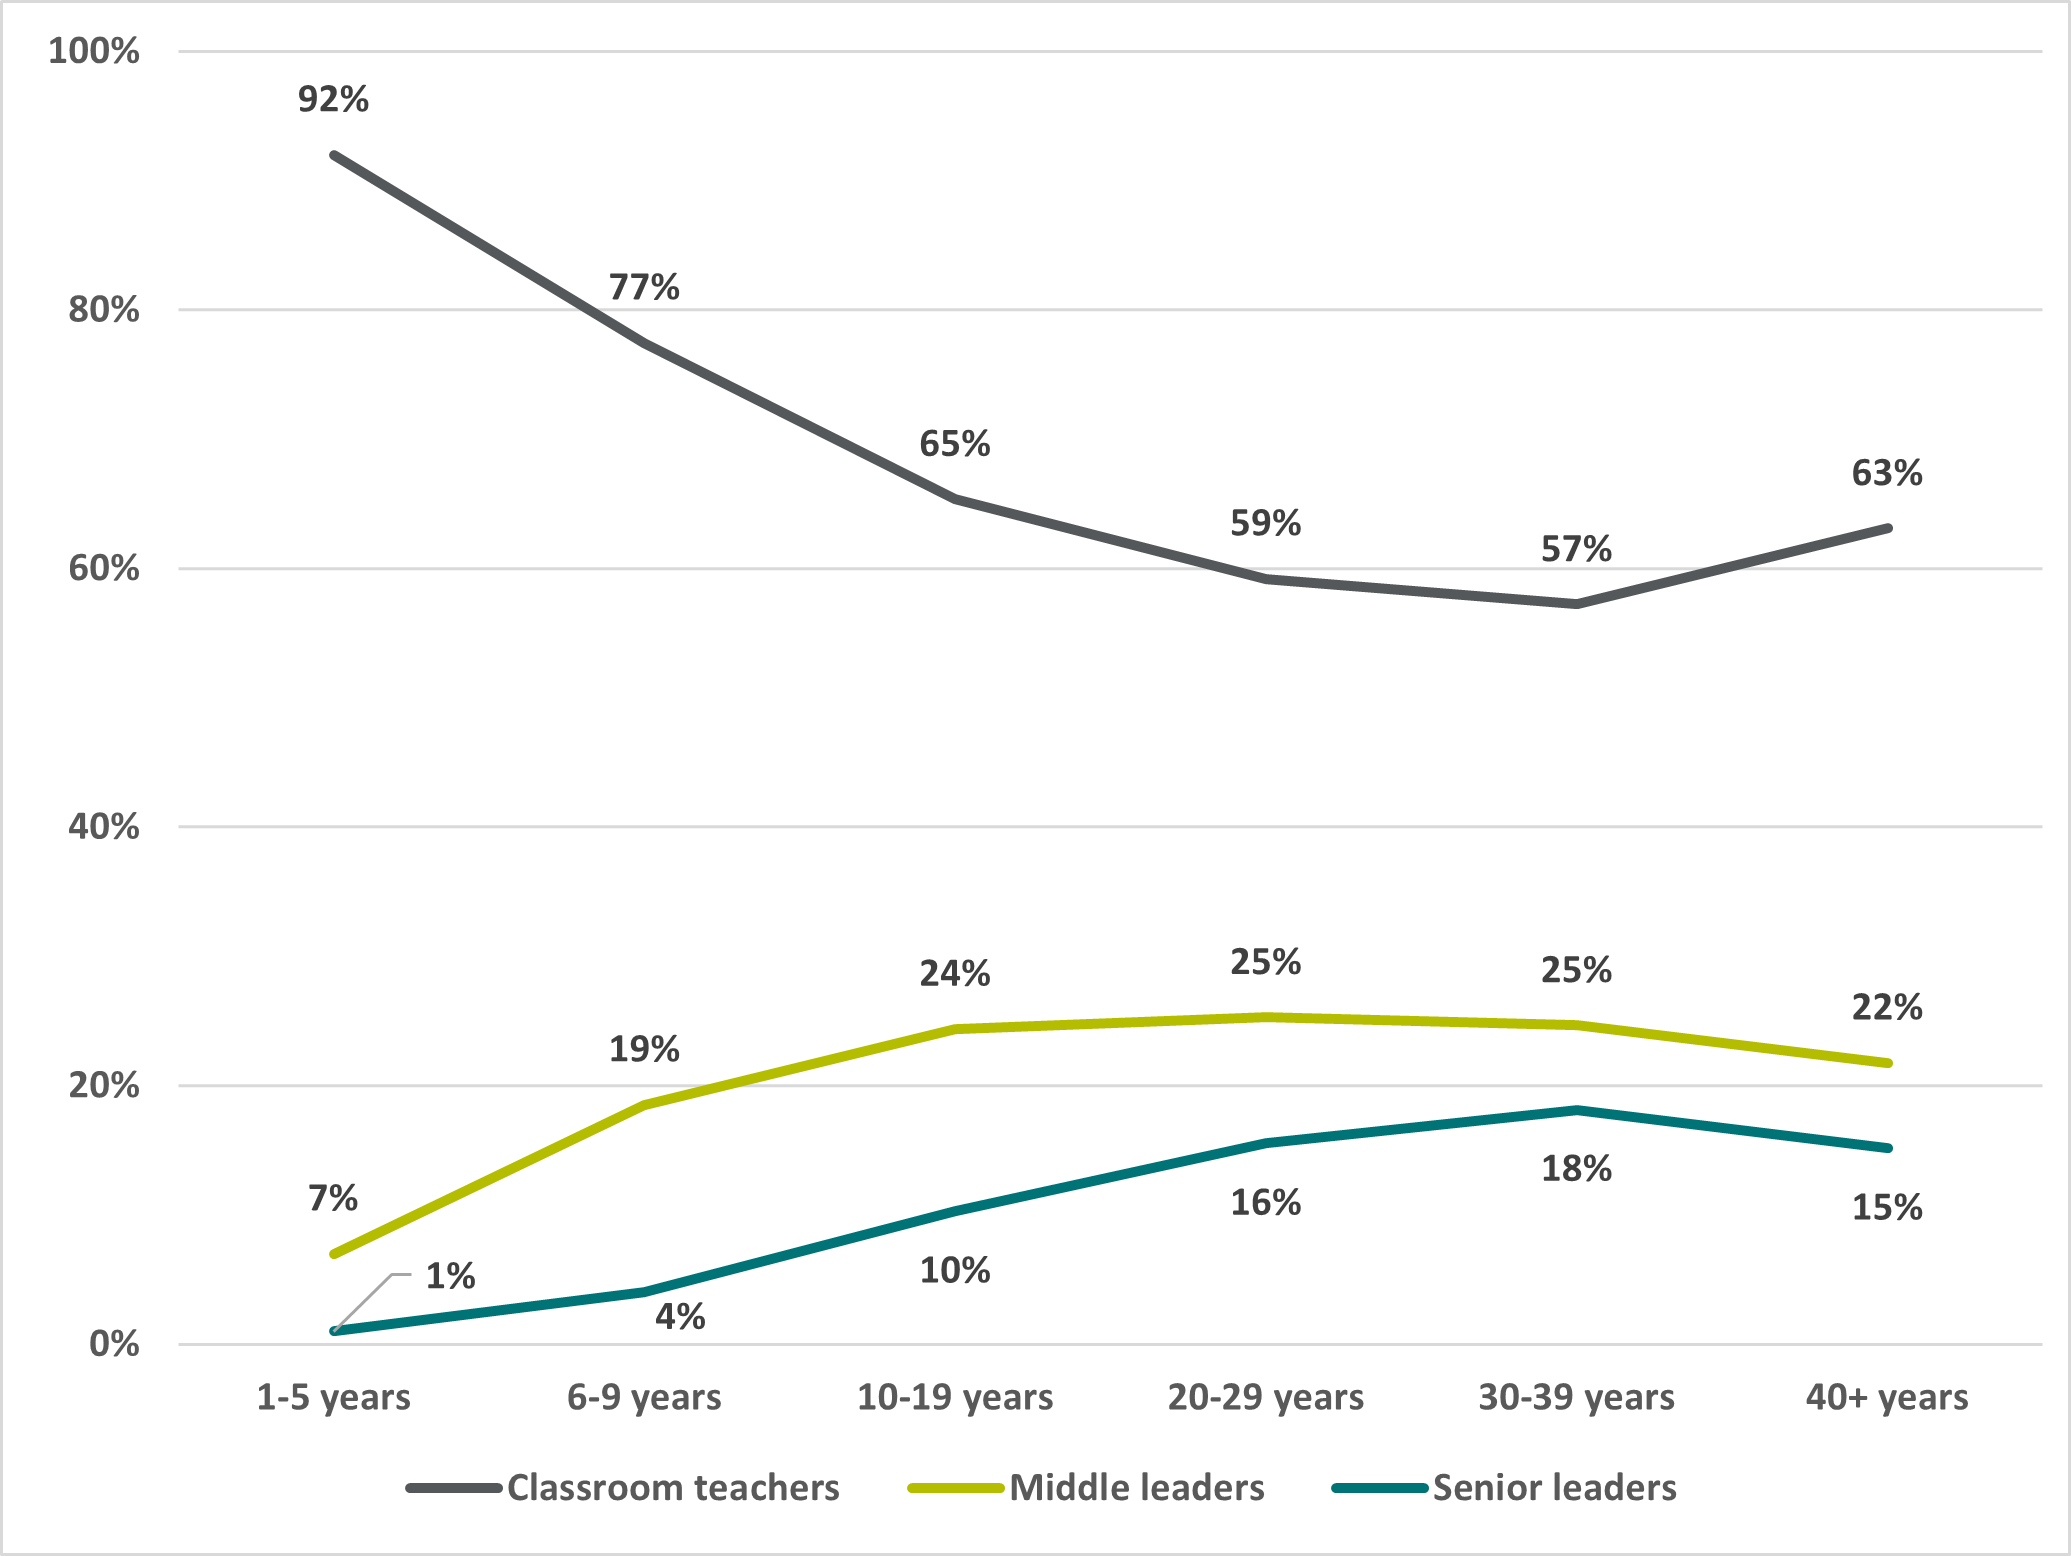 Figure 9: Years in the profession for the non-CRT teacher workforce, by position in school, 2022
Though unsurprising, these findings relating to years in the profession emphasise the evolving nature of teaching and leadership as educators progress through their careers. While early career teachers are primarily deployed as teachers without leadership
responsibilities, opportunities to engage in leadership positions alongside teaching responsibilities and senior leadership roles emerge with more years in the profession. Understanding the distribution of positions in schools by experience is vital
for workforce planning and professional learning initiatives. By recognising the varied roles and responsibilities at different points during a teaching career, education systems can tailor support, training, and mentorship programs to enhance the
skills and capacities of teachers across all roles, ultimately fostering a well-rounded and effective teacher workforce.
There are trends over time in the different contractual arrangements for teaching staff, both by jurisdiction and role. At the national level, there has been a decline in the proportion of registered teachers reporting that they are employed on a fixed
term contract of one year or less in duration (14% in 2019 and 11% in 2022), and a corresponding increase in those reporting ongoing/permanent contracts (73% in 2019 and 75% in 2022) or fixed term contracts of more than one year (4% in 2019 and 5%
in 2022). This shift has occurred to varying degrees across jurisdictions. For example, in NSW the proportion of teachers in permanent roles has remained relatively stable at 70% in 2019 and 69% in 2022, however there was a slight shift from fixed
term contracts of one year or less (18% in 2019 to 15% in 2022) to fixed term contracts of more than one year (3% to 5%). Conversely, in SA, the proportion of registered teachers in permanent roles declined slightly from 63% to 61% from 2019 to 2022,
as did those on fixed term contracts of one year or less (19% to 17%).
When examined by role position in a school, there are several insights into contractual arrangements that emerge. The proportion of classroom teachers on fixed term contracts of one year or less has declined over time from 22% in 2019 to 15% in 2022.
In the same period, permanent roles have increased from 74% to 79%. Most middle leaders (92% in 2022) are employed on an ongoing/permanent basis, and this has been stable over time. While few senior leaders are on fixed term contracts of one year
or less (6% in 2019 and 2022), the proportion on fixed term contracts of more than one year has declined over time (10% in 2019 to 7% in 2022) while those in ongoing/permanent positions has increased (from 84% to 87% in the same period).
There are indications that early career teachers are securing longer term fixed contracts or permanent roles. For those early career teachers who are working as classroom teachers and are not CRTs, the proportion on contracts longer than 1 year or in
ongoing/permanent positions has increased from 61% in 2019 to 69% in 2022. This suggests early career teachers are increasingly working under more stable and secure employment arrangements (AITSL, 2023).
In addition to an increasing trend towards ongoing/permanent contracts, registered teachers have also become increasingly likely to be working full-time (0.95-1 FTE[9]).
At the national level across all positions in schools, there has been a drop in the proportion of registered teachers working 4 days per week (17% in 2019 to 9% in 2022) or less than 4 days per week (24% in 2019 to 17% in 2022). In the same period,
full-time employment has increased from 58% to 74% of the teacher workforce. This trend towards full-time employment has been relatively consistently observed over time, in most jurisdictions. There are also some distinct differences in contracted
hours between the various positions in schools. For example, in 2022, nearly all senior leaders (95%), and most middle leaders (85%) reported being employed for full-time hours, compared to nearly three-quarters of classroom teachers (74%).
Casual/relief contracts
At the national level, the proportion of teachers reporting that they are employed on a casual/relief contract has remained relatively steady from 2019 (9%) to 2022 (10%). This has varied somewhat between jurisdictions. For example, in NSW, casual/relief
contracts have increased slightly from 9% in 2019 to 11% in 2022. In SA there have been fluctuations in the number of registered teachers reporting being employed under casual/relief contracts over time that are possibly due to the pandemic (11%
in 2019, 12% in 2020, 9% in 2021, 13% in 2022). Less than a third of all CRTs reported full-time working hours in 2022 (29%). Most CRTs work less than 4 days per week (60% in 2022).
Taken together, these findings indicate that fewer teachers are working on a part-time basis, which may have ramifications for flexibility in employment arrangements, but there is also greater stability in teachers’ contractual arrangements. Understanding
trends over time in teacher employment arrangements, including contract length and FTE, offers valuable insights into job security and work stability in the profession, which can impact teacher recruitment and retention. For example, in NSW one of
the strategies being deployed to address the teacher shortage crisis in government schools is to offer permanent contracts to temporary teaching and support staff. It is hoped that this contract conversion will help retain staff in schools (NSW Department
of Education, 2023). This is just one example of data-driven insights being used by policymakers to develop teacher retention initiatives.
Employee retention is an enduring challenge for all employers, workplaces and industries. Teaching is no different. At present, in both Australia and around the world, we are facing a critical shortage of teachers. Other industries are facing similar
challenges, such as nursing and the Australian Defence Force (Hurst, 2023; MacDonald & Stayner, 2022). The COVID-19 pandemic has exacerbated existing workforce challenges and necessitated a strong examination of recruitment and retention strategies
to make sure we have the right people in the right industries to meet the needs of a growing Australian population.
The pandemic has prompted many workers to rethink the ‘what, where, why and how’ of work (Sutton, 2022). This re-examination of work didn’t begin with the pandemic – but it has been accelerated by the changes workers experienced
during rapid moves to remote work/learning, the isolation wrought by lockdowns and the shifting economic landscape of a post-pandemic recovery. As younger generations advance through their working lives, it is becoming increasingly common for workers
to have more jobs and change careers more often than ever before. This mobility in employment means it is less likely for people to choose a career as young adults and remain in one profession until retirement. All industries must grapple with such
generational change. Given the large proportion of teachers approaching retirement age in the next decade, combined with the current shortage, this is a particularly urgent challenge for the education profession in Australia.
Understanding the factors exerting pressure on the teacher workforce is key to implementing targeted attraction and retention strategies. Having a clear picture of the workforce experience, including workload and career intentions, can provide insight
into workforce wellbeing and sustainability. By understanding trends over time and the demands placed on teachers' time, we can explore strategies to improve teacher deployment, reduce workload burdens, and enhance teacher retention while also attracting
new talent to the profession. Exploring the way teachers work, including flexibility, school culture and societal expectations of teaching, can provide insights into both teacher retention and the attractiveness of the profession within the broader
Australian workforce context.
Different workforces were impacted in varying ways by repeated COVID-19 induced lockdowns, increased rates of employee absence due to illness, and decreased migration flows. For teachers, the last few years have been marred by disruption, from lockdowns
that forced rapid moves to online teaching, to the aftermath of these periods where students may have needed extra instruction to catch up on lost learning, or additional support for their social and emotional wellbeing.
The increasing pressure on teachers has been exacerbated during the pandemic, but these issues didn’t originate with COVID-19. Though teaching is an incredibly valued and rewarding profession, it is also highly demanding. The job requirements for
teachers have been expanding in recent decades, as society’s expectations of what teachers and schools can and should deliver to our increasingly diverse student population have changed (Hunter & Sonnemann, 2022). This means that teaching
as a profession has become more difficult – it has become harder for teachers to meet what is expected of them in a 38-hour work week (Hunter & Sonnemann, 2022)
Evidence consistently demonstrates that teachers work long hours and that high workloads, especially when high levels of non-teaching duties like administrative tasks are reported, are a considerable source of stress (Carroll et al., 2022; OECD, 2020).
It is therefore unsurprising – though concerning – that pre-pandemic, both internationally and in Australia, high levels of occupational stress have been recorded for teachers (OECD, 2020). Principals report even higher levels of stress
at work than classroom teachers (Sebastian et al., 2023). This stress can be seen in data relating to registered teachers’ self-reported intentions to leave the profession, which have increased over time. However, teachers are not alone in this.
The longer-term impacts of the COVID-19 pandemic are yet to be fully realised. What we do know is that across industries, workforces are still feeling disruption. In America, this disruption has been coined ‘the great resignation’ after a
large number of people quit their jobs in 2021 and 2022 (Ellerbeck, 2022). Though we haven’t experienced excessive rates of resignations in Australia, we are experiencing a noteworthy and troubling mass exhaustion or burnout among Australian
workers across all industries (Ruppanner, Churchill, & Bissell, 2023). In a survey of 1,800 Australian workers across industries, PwC found that 38% of respondents were looking to leave their job in the next 12 months and only 55% intended to
remain with their current employer for at least 5 years (PwC, 2021). Researchers from the University of Melbourne surveyed 1,400 Australian workers across industries and found similar results – 1 in 3 workers aged 18-54 reported considering
quitting their job, compared to 1 in 5 older workers (Ruppanner, Churchill, Bissell, et al., 2023). Concerningly, Ruppanner et al. (2023) found that 1 in 2 Australian workers aged 18-54 reported feeling exhausted at work. People in the 18-54 age group
are less motivated about their work (40%) and report struggling to concentrate because of non-work-related responsibilities (33%). Their mental health is also poorer than older workers (55 and over). These survey findings support the notion that rather
than a ‘great resignation’, Australia is facing a ‘great exhaustion’ (UNSW, 2022).
Further evidence of this is provided by ABS employment statistics which show job mobility is up – in the 12 months prior to February 2022, 9.5% of all employed Australians changed jobs, the highest rate since 2012 (ABS, 2022). The former National
Skills Commission (NSC) reported that the labour market tightened in 2022, meaning employers are increasingly competing for workers and are unable to fill some vacancies, resulting in a diverse range of occupations experiencing shortages. While unemployment
rates have fallen to record lows, job advertisements to fill vacancies have markedly increased – this trend of growing labour demand has been seen since mid-2020 (National Skills Commission, 2022).
This trend has been particularly evident in certain professions, especially among health professionals. In fact, of those people who changed jobs in 2021, the largest portion left their job in the healthcare and social assistance industry (12.2% of the
2.1 million people who left or lost a job in the 12 months prior to February 2022; ABS, 2022). The NSC suggested this may indicate that the healthcare and social assistance workforce is experiencing instability at least in part due to worker burnout
due to the COVID-19 pandemic. Given the healthcare industry has operated on the frontlines during the pandemic, these indications that the workforce is experiencing stress is both concerning and unsurprising, especially given the largest portion of
the healthcare industry – nursing – has been experiencing shortages for some time (Health Workforce Australia, 2014). Recent survey results from the Australian Primary Health Care Nurses Association (APNA) provides further evidence that
the nursing workforce is under extreme pressure. Of the 1,061 survey respondents, 80% reported feeling exhausted at work and 79% reported feeling burnt out. Around three-quarters (73%) of the nurses surveyed said they work too much. Concerningly,
29% reported plans to leave their current job in 2-5 years (APNA, 2022). Combined, these Australia-wide employment figures as well as the shortages currently being experienced in the health workforce demonstrate that the challenges of recruitment
and retention are being felt not just in education, but across a range of industries.
Like other Australian workers, a considerable proportion of teachers report their intentions to leave their profession before retirement and some intend to leave very soon. Examining the reasons teachers give for these intentions can reveal some actionable
trends and opportunities to make improvements aimed at retaining the teachers we have and attracting new talent to the profession. Given the strong evidence of high job mobility within the wider workforce, this examination is timely as there is great
potential to attract workers interested in a career change into teaching.
Intentions to leave the teaching profession have increased over time, particularly for those reporting an intent to leave in the near future. In line with the sentiments of the broader Australian workforce, in 2022 around 35% of the teacher workforce
reported that they do not intend to remain in teaching until retirement.[10] This total of 35% includes those who express an intent to leave very soon or in the medium
to long term, as well as those who are unsure on their timeframe for departure (Figure 10, ‘Leave’). Notably, of the total teacher workforce, 5% report their intent to leave the profession within a year and a further 8% report their intent
to leave in 2-4 years. These reported intentions to leave in the immediate future (within 5 years) have increased over time, more so than longer term intentions (leave within 10 years), which have remained stable.
The proportion of teachers who intend to leave but are unsure on their timeframe has increased over time from 6% in 2019 to 8% in 2022. The proportion of the teacher workforce who intend to remain until retirement has declined over time (from 41% in 2019
to 31% in 2022). More than a third (35%) were unsure of their career intentions and this has been relatively stable over time. This suggests there is broad scope to retain these undecided teachers in the profession.
Teacher attrition
It is important to note that reported intentions to leave teaching will not necessarily result in actual attrition. International data suggests that rates of reported intention to leave the profession[11] of 30-40% may result in actual turnover closer to 10-15% (Räsänen et al., 2020). The ATWD captures information about teacher attrition in several ways including the proportion of initial teacher education (ITE) graduates who discontinue
their teacher registration year on year.[12] Most of the 2019 cohort of ITE graduates (95%) were registered in 2020.[13] Similarly,
by the end of their early career (within their first 5 years in the profession), most of the 2015 graduates (91%) remained registered in 2020. Examining registration continuation by year of ITE graduation reveals a mostly linear trend whereby
for every successive year in the profession, the proportion of the ITE cohort who continue to maintain teacher registration drops by 1.3 percentage points.[14] There are many reasons teachers may maintain their registration despite not teaching (and in some jurisdictions registration may last for more than one year). While actual attrition rates from the teacher workforce may be higher than these figures
suggest, these data provide some solid indications that relatively small numbers of teachers in the early stages of their career discontinue registration each year.
To find out more about currently available information on teacher attrition and supply, see the ATWD National Trends: Teacher Workforce publication
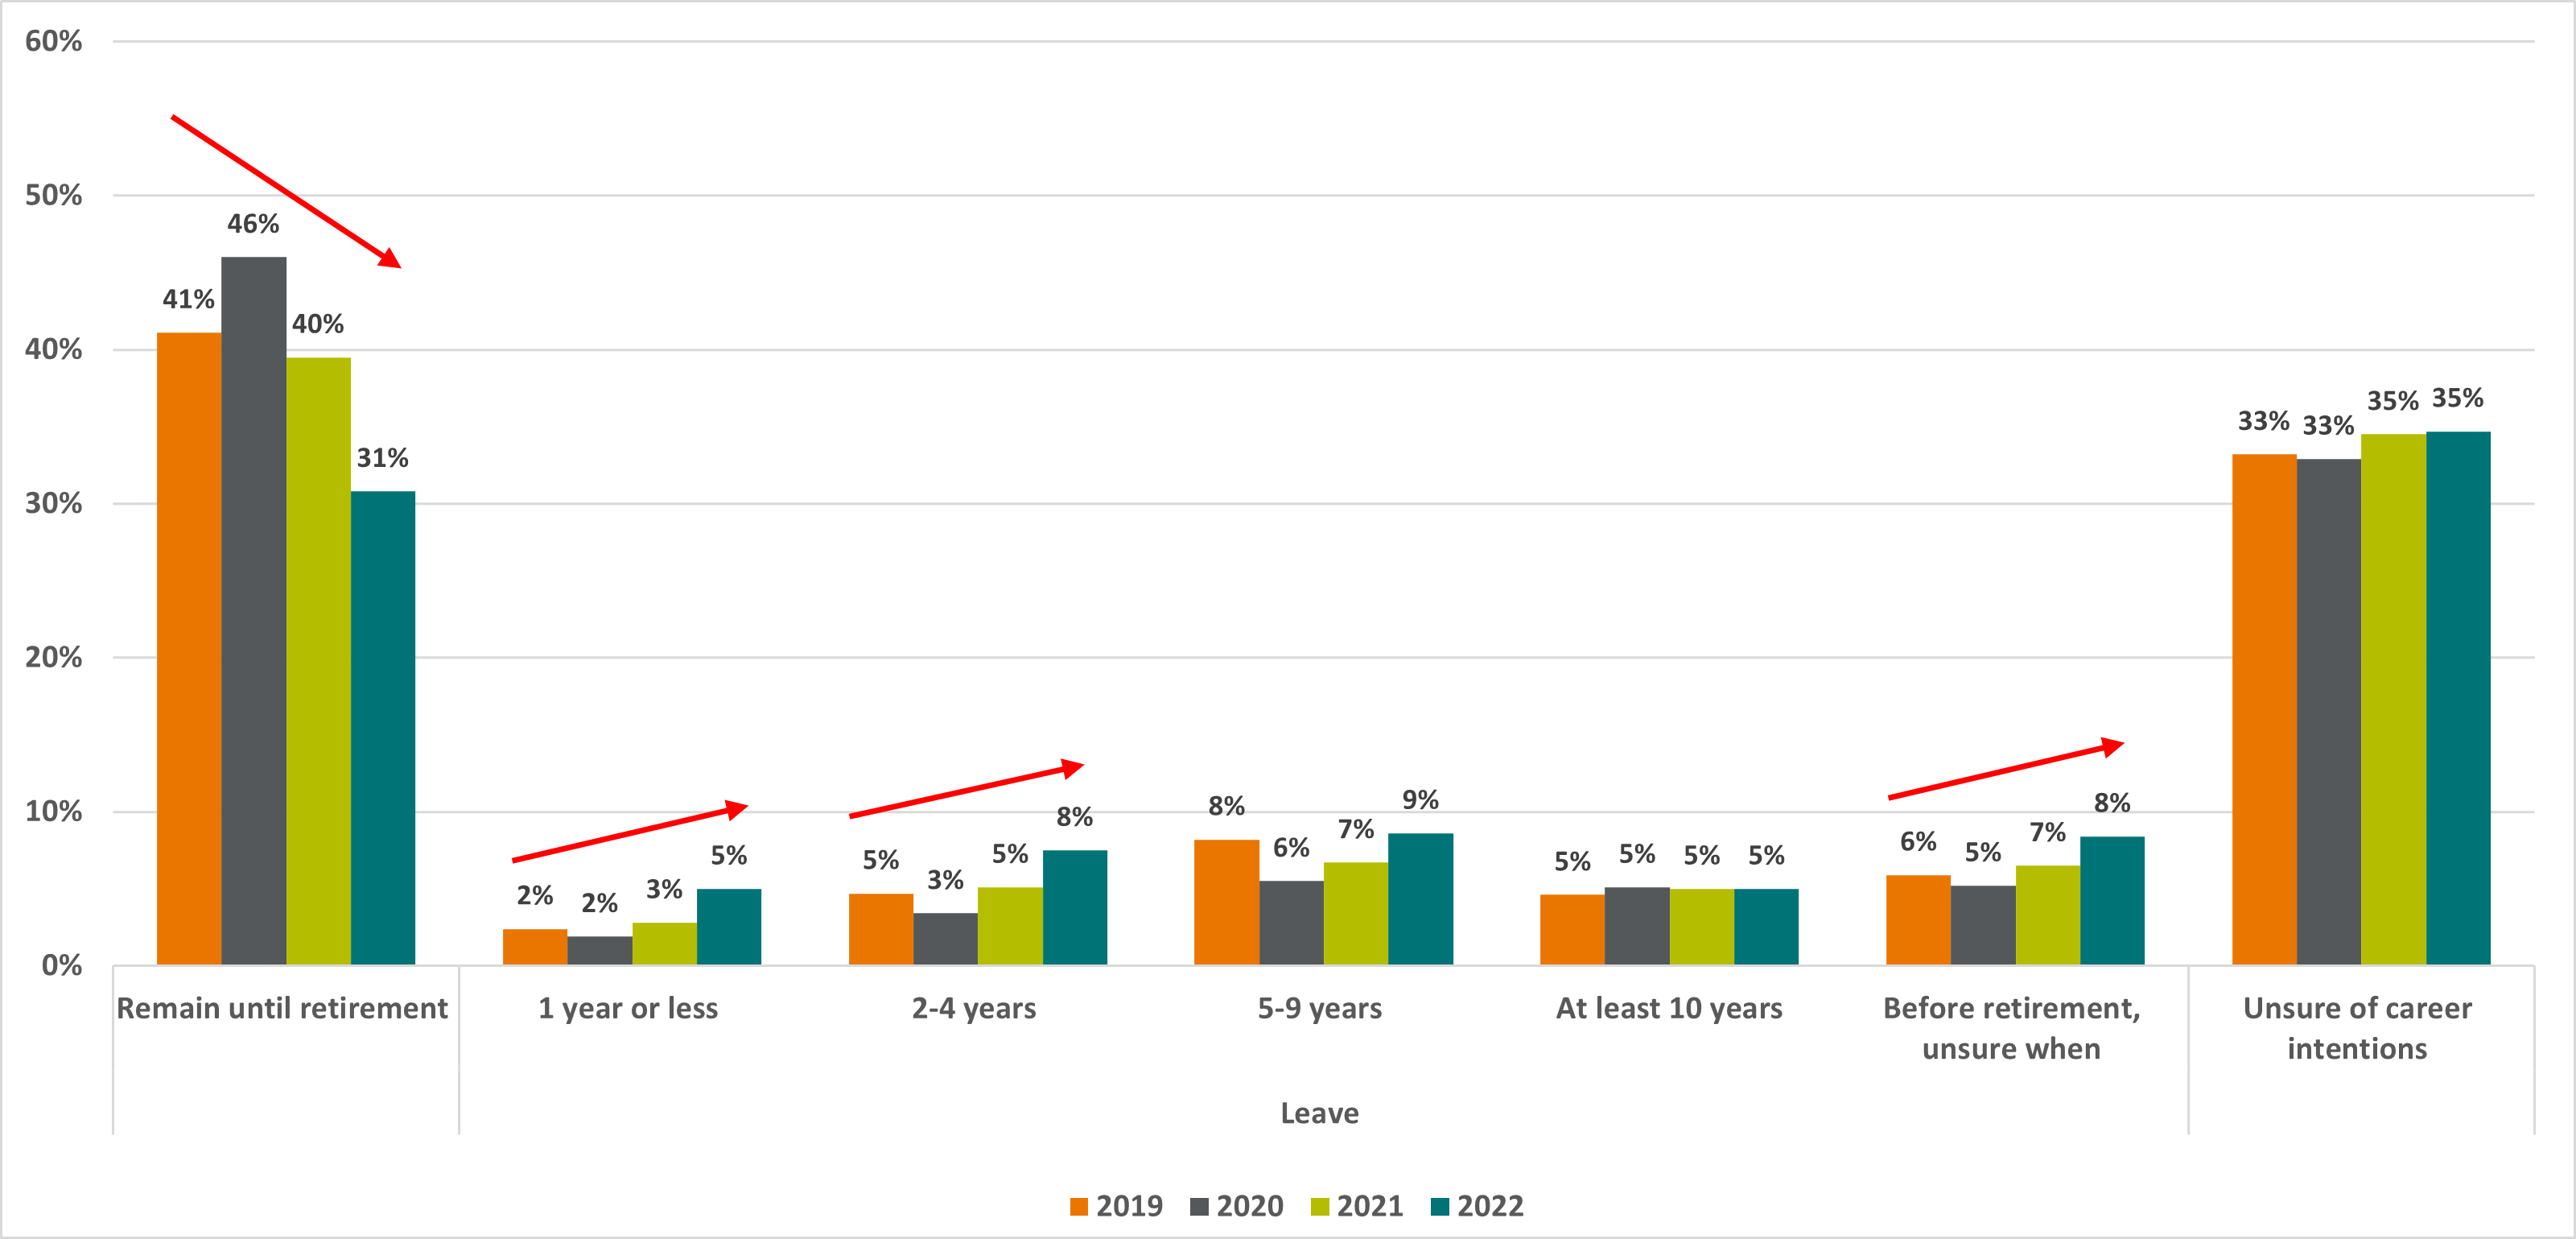 Figure 10: Career intentions, teacher workforce, by year
During the uncertainty and pressures of the early stages of the pandemic in 2020, intentions to leave the profession dropped for all positions. However, as shown in Table 1, since the low of 2020, intentions to leave the profession prior to retirement
increased for all positions in schools in 2022. More than a third of classroom teachers (34%) and middle leaders (35%) expressed intent to leave before retirement in 2022. A lower proportion of senior leaders (30%) reported an intent to leave. This
could be due to job security/satisfaction and pay (as this cohort are typically more likely to be employed on permanent contracts), or age (given that most senior leaders have many years’ experience in the profession and are, therefore, closer
to retirement than some classroom teachers and middle leaders).
Table 1: Reported intentions to leave the profession before retirement, by position in school and year
| 2019 | 2020 | 2021 | 2022 |
|---|
| Classroom teachers | 28% | 23% | 28% | 34% |
| Middle leaders | 26% | 21% | 26% | 35% |
| Senior leaders | 19% | 16% | 20% | 30% |
| CRTs | 23% | 18% | 22% | 28% |
It is important to note that a large proportion of teachers and leaders report uncertainty in their career intentions. Though in 2022, 34% of classroom teachers reported their intention to leave before retirement, 37% were unsure. Similarly, 34% of middle
leaders, 29% of senior leaders and 32% of CRTs were unsure. This suggests there are many teachers and leaders who are undecided about their career intentions, meaning targeted retention initiatives have considerable scope to make a positive impact.
Of those who intend to leave before retirement, more than a third of classroom teachers (36%), middle leaders (35%) and senior leaders (32%) said they intend to leave within 5 years. Again, many were unsure of how long they would remain in the profession
despite reporting an intention to leave at some point in the future (Figure 11).
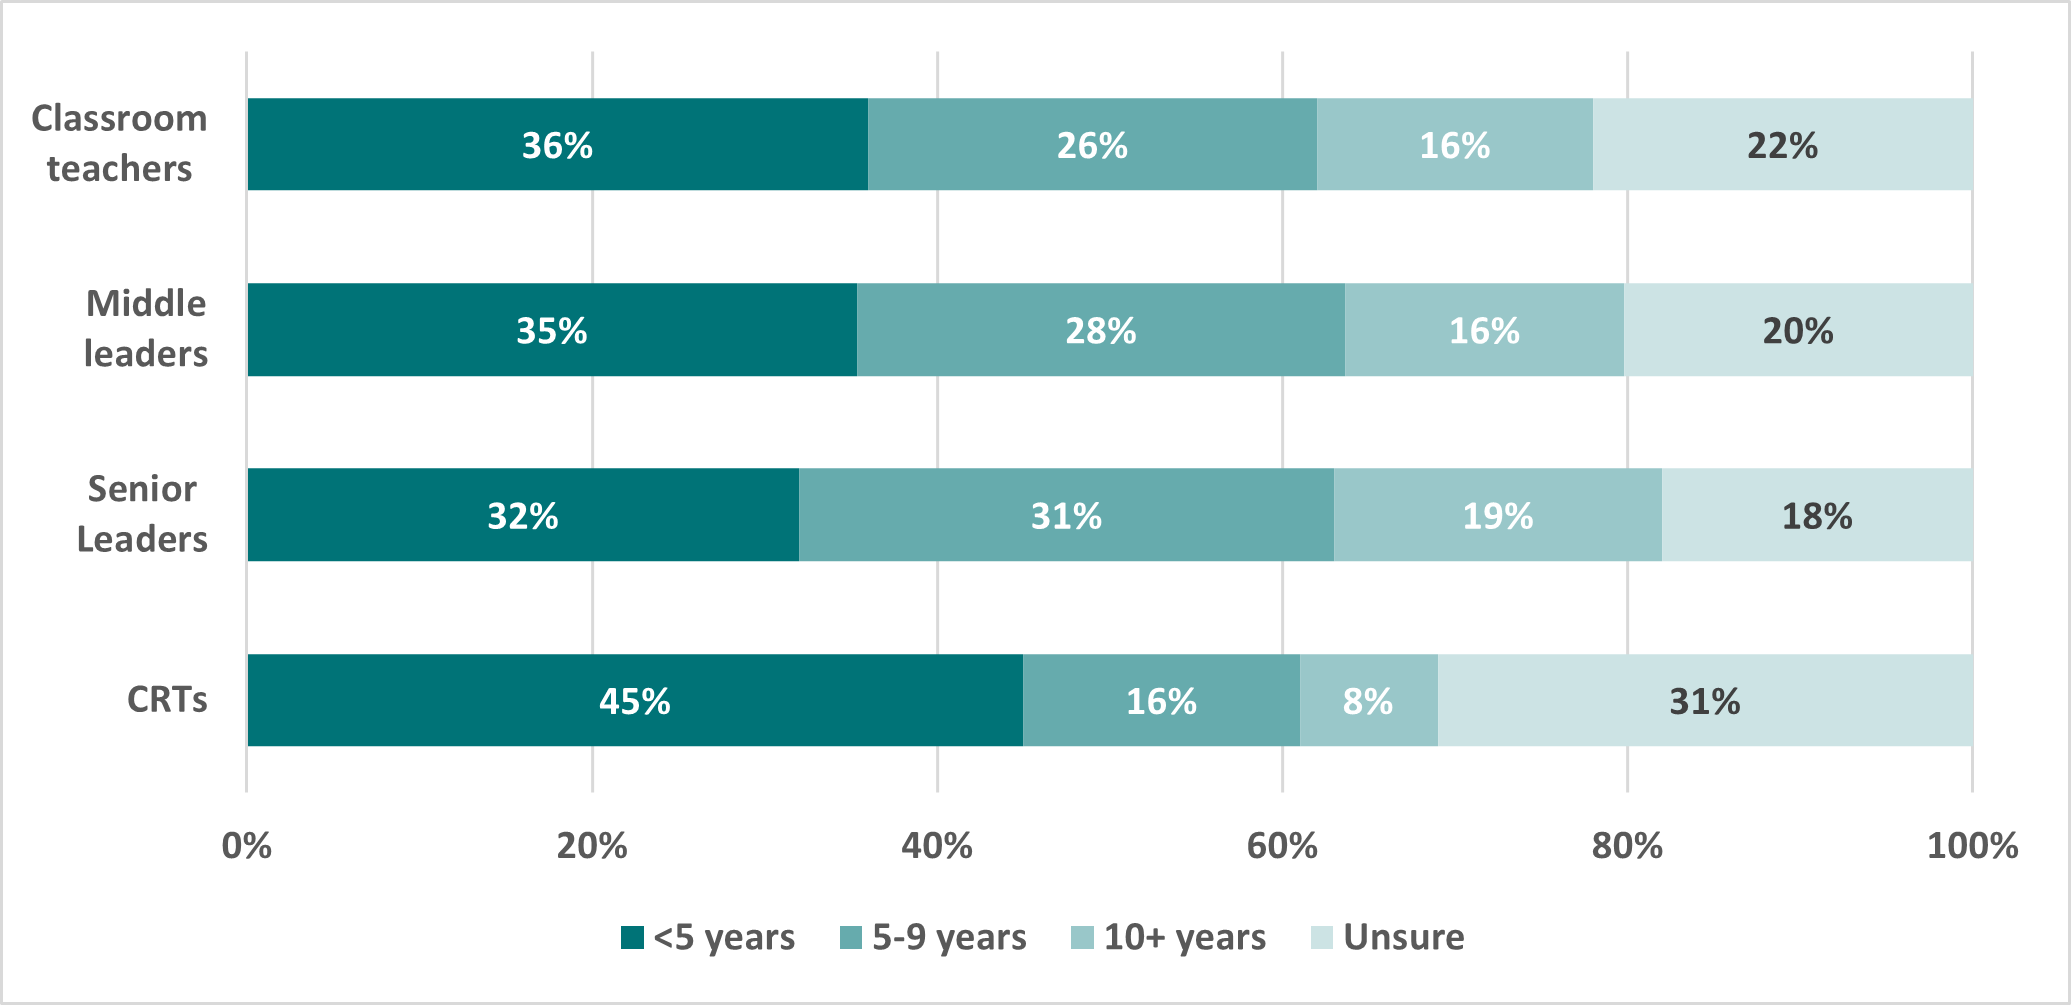 Figure 11: Years intending to remain in the profession for those who intend to leave prior to retirement, by position in school, 2022
Across all positions in schools, the order of the top three reasons affecting teachers’ intentions to leave the profession prior to retirement have not changed over time.[15] Factors relating to workload and coping (work/life balance, mental health and wellbeing, high workload), recognition and reward (recognition within the school, public perception of the profession, pay) and classroom factors (classroom behaviour, class
size, support staff) were most commonly selected by teachers and leaders alike. From 2019 to 2022, the frequency with which most factors were selected increased, for all positions in schools. Most classroom teachers (92%), middle leaders (91%) and
senior leaders (92%) who reported their intention to leave the profession before retirement selected workload and coping factors as reasons for considering leaving. These factors have consistently ranked first over time, as the top considerations
for peoples’ intentions to leave the teaching profession before retirement.
Other data sources support the ongoing prominence of classroom factors in the ranking of factors affecting teachers’ career intentions. Responses to the Teaching and Learning International Survey (TALIS) in 2018 indicated that 37% of Australian
lower-secondary school principals reported that intimidation or bullying among students occurs at least weekly, and that a lower proportion of Australian teachers report feeling prepared for, or capable of, managing disruptive classroom behaviour
when compared with their peers in other OECD countries (OECD, 2020). Students echo these reports from teachers and leaders. In the Programme for International Student Assessment (PISA) in 2018, Australian students’ perceptions of the disciplinary
climate in Australian schools was among the least favourable in the OECD (index of disciplinary climate, Australia: -0.20; OECD: +0.04) (OECD, 2023).
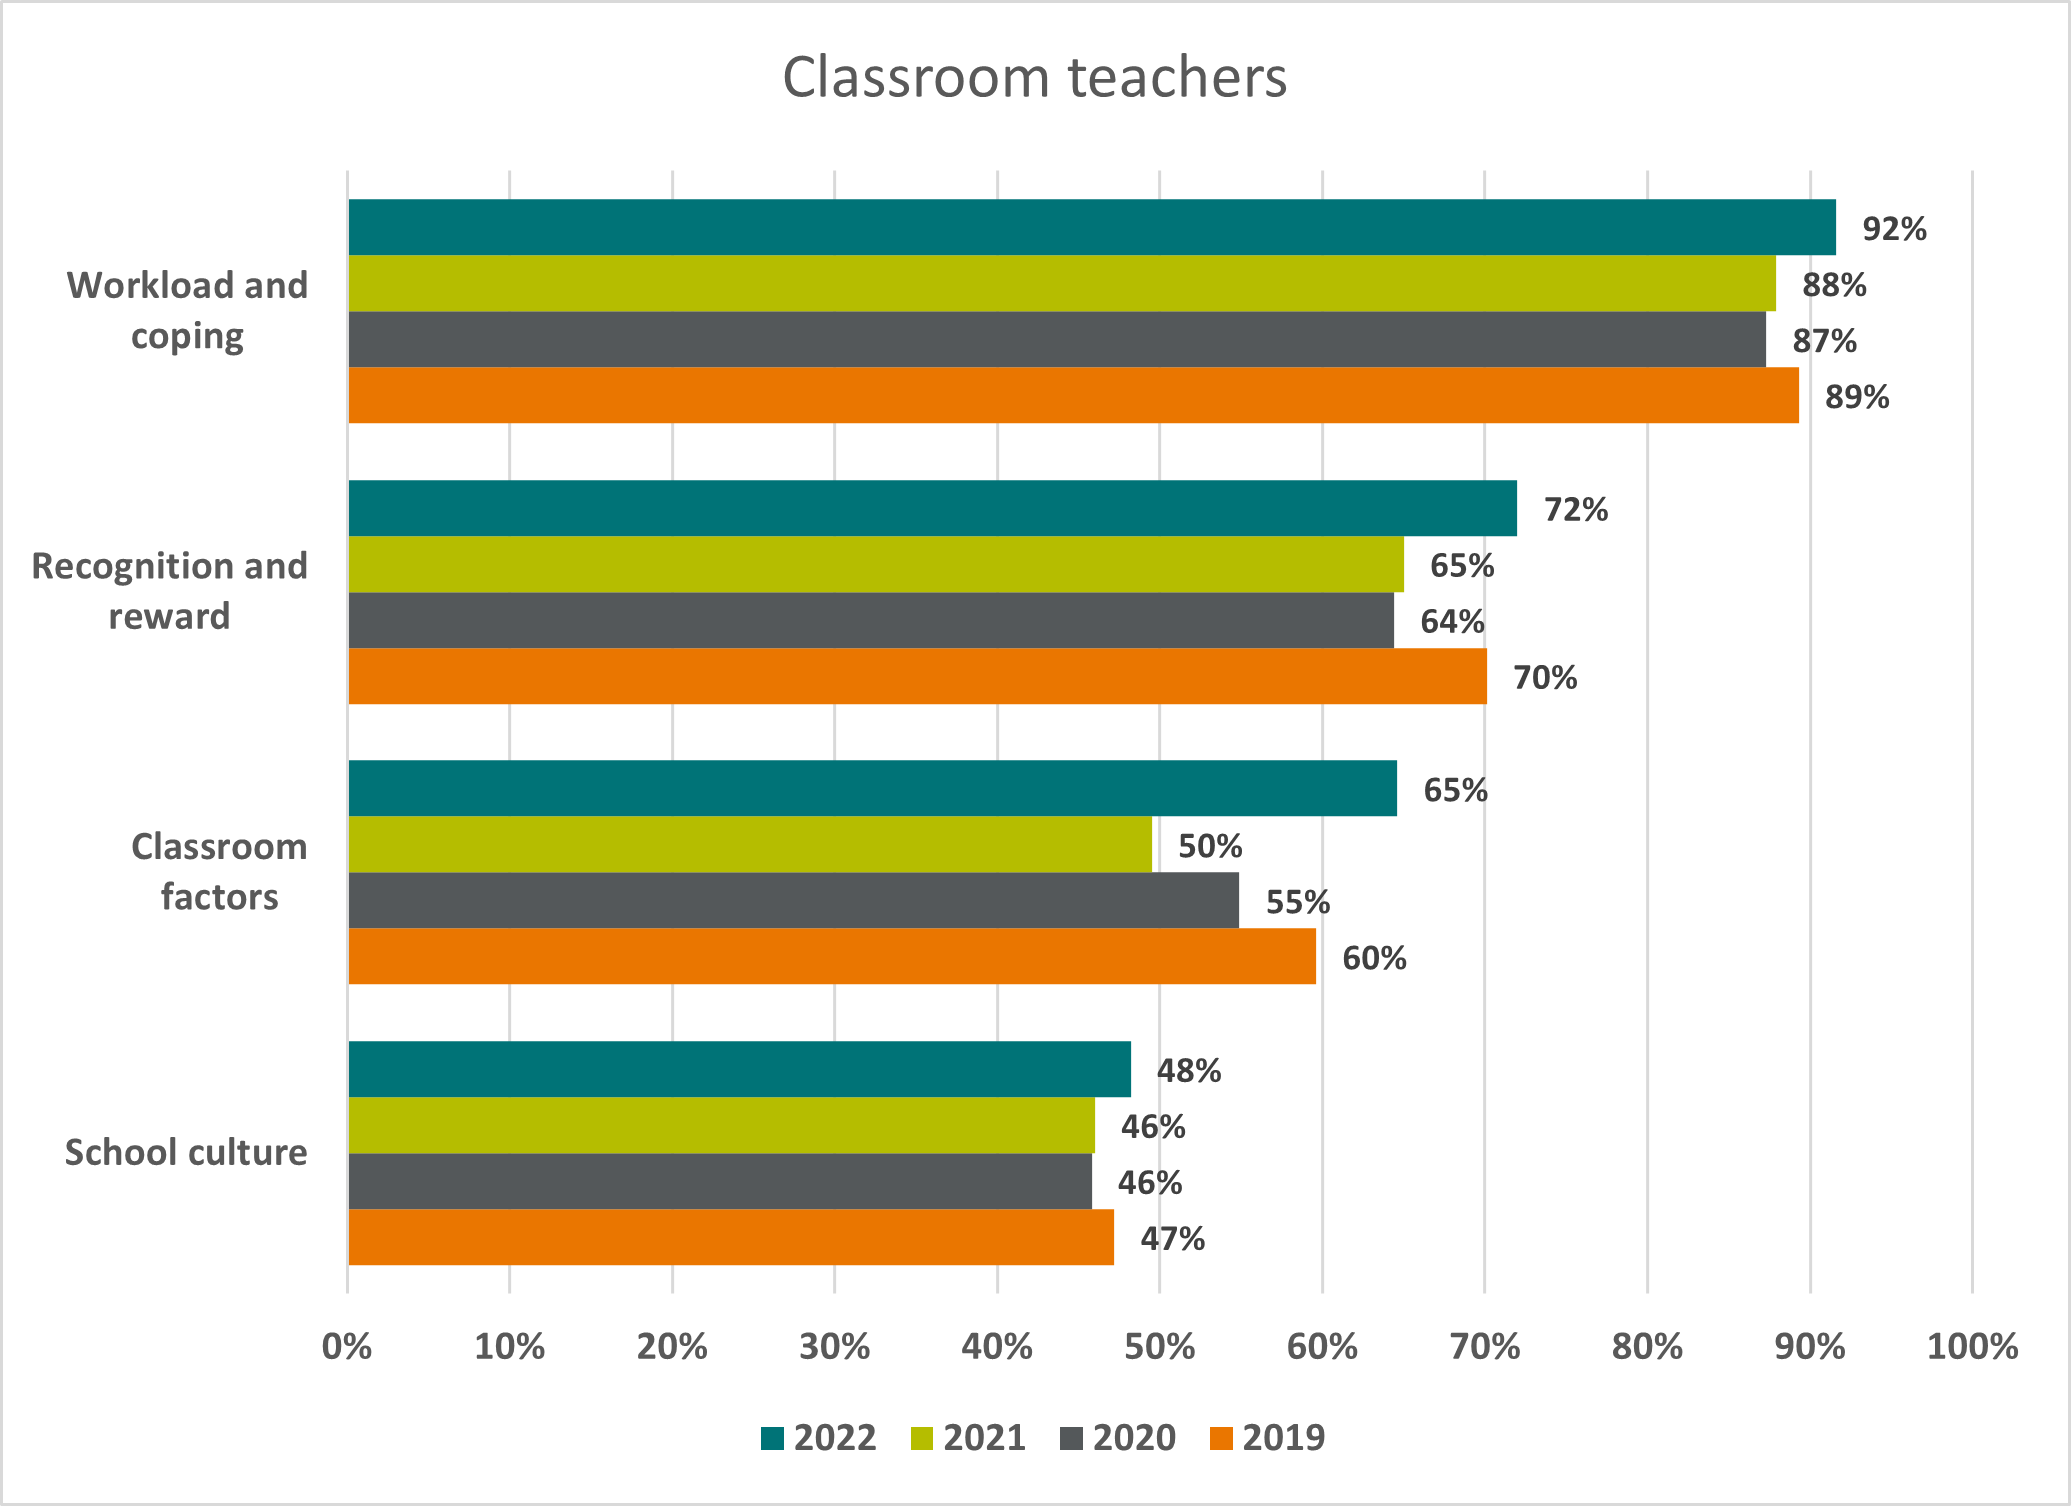 Figure 12: Factors influencing classroom teachers’ intentions to leave the profession before retirement, by year
Though classroom teachers, middle leaders and senior leaders tended to report similar factors affecting their career intentions, school culture appears to sit differently for the different roles. A lower proportion of senior leaders (38%) selected school
culture as a reason negatively affecting their career intentions compared to classroom teachers (48%). This trend is also evident for people who reported an intention to remain in the profession until retirement.
The proportion of teachers and leaders who express an intent to stay in the profession until retirement has declined in recent years (Figure 10). Though reasons for this career intention varied, there were some differences between positions. For example,
classroom teachers (43%) were less likely to choose school culture as a factor affecting their intent to remain until retirement than senior leaders (58%). These data indicate that school culture influences the career intent of classroom teachers
and senior leaders differently. It appears to act as less of a protective factor for classroom teachers than leaders. Senior leaders play a crucial role in building and fostering positive school climate (AITSL, 2020, 2022b). These data suggest there
is potential for school climate to influence classroom teachers’ career intentions more positively.
The data presented here provide insight into the workforce pressures that may be motivating teachers to consider leaving the profession. These pressures are critical levers when it comes to teacher retention. While some retention factors sit at the system
level, such as financial incentives, others operate at the individual (intrinsic motivation for teaching and teacher self-efficacy) or school levels. In a recent review of teacher quality, recruitment and retention, the Education Endowment Foundation
(EEF) examined the evidence behind strategies for the recruitment and retention of skilled teachers in disadvantaged areas (EEF, 2023). This review identified several school-level factors backed by evidence, that have the potential to improve teacher
recruitment and retention:
- Manageable workloads, including protected planning time, reasonable hours and class allocations. “Teachers who rated their workload as more suitable were more likely to be retained” (p.22).
- Professional learning is important, particularly for supporting teacher efficacy which is an individual-level factor that supports retention.
- Induction, coaching and mentoring are particularly important retention strategies for early career teachers. Like professional learning, supports for early career teachers can foster teacher self-efficacy.
- Effective school leadership – aware and supportive of staff needs, visible, appropriately allocates work.
- Relationships (including with parents and students) and opportunities for collaboration (planning or learning teams, within and beyond the school).
- School climate in terms of school discipline and positive behaviour.
The review also indicates that recruitment and retention require tailored approaches: “Different factors may be significant at different stages of a teacher’s career. For early career teachers, induction support and mentoring would be important,
while for mid-career teachers, autonomy might be more significant. Later career teachers might be retained through continuing to recognise their status within and value to the school” (EEF, 2023, p. 22, summarising Tran & Smith 2020). Additionally,
retention may be increased by implementing strategies designed to target individual-level factors that influence teacher self-efficacy, teachers’ sense of belonging to the school and levels of stress at work.
These findings from research match what teachers have consistently said in the Australian Teacher Workforce Survey through the ATWD. By better understanding approaches that are both backed by evidence and reflective of teacher experiences, strategies
that have the greatest chance of success can be prioritised.
Induction experiences
Induction experiences are critical for ensuring the success and wellbeing of early career teachers, as well as for improving the overall quality of education for students. High quality induction plays a role in supporting early career teachers to
develop their practice, meet the challenges of workload and classroom management, while helping them to manage their wellbeing and the demands of their role (AITSL, 2022a). By providing new teachers with the support, guidance, and resources they
need to be successful, induction programs can help improve teacher retention rates. Effective induction programs can help new teachers develop the skills and confidence needed to be successful in the classroom, which can lead to job satisfaction
and a sense of purpose.
Between 2020 and 2022, the proportion of all early career teachers who reported receiving a formal induction decreased. This decrease was more pronounced for those with more years’ experience. In 2022, 57% of early career teachers with 1-2 years’
experience reported receiving formal induction, down from 61% in 2020. In the same period, early career teachers with 3-5 years’ experience dropped from 65% to 59% who reported receiving a formal induction. From a workforce recruitment and
retention viewpoint, these declines in rates of formal induction are concerning.
In the National Teacher Workforce Action Plan, AITSL has been tasked with further developing nationally consistent guidelines to support early career teachers and new school leaders including mentoring and induction. This work will complement a suite
of existing AITSL tools and resources aimed at supporting beginning teachers and their mentors.
For more information on AITSL induction resources, visit: https://www.aitsl.edu.au/lead-develop/develop-others/support-new-teachers
Australian teachers consistently report working more than the standard 38-hour workweek. While there has been a gradual reduction in average hours worked in the period 2019-2022, teachers continue to dedicate significant additional work time to their
profession. In 2022, full-time classroom teachers reported working an average of 53.7 hours per week, senior leaders reported 58.6 hours per week, and middle leaders reported 55.3 hours per week (AITSL, 2023).
For classroom teachers, and leaders with teaching responsibilities, these work hours are split between face-to-face teaching and non-teaching tasks. Enterprise bargaining agreements (EBAs) differ between jurisdictions and sectors however in general, across
states and territories, teachers in government schools are allotted 21.5-24 hours of face-to-face teaching per week (AITSL, 2023). However, 50% of full-time classroom teachers report undertaking more than 24 hours of face-to-face teaching per week
(AITSL, 2023). The reasons for the discrepancy between teachers’ self-report and EBAs requires further scrutiny, including how this may differ by school type (primary versus secondary) or school context. As improvements are made to the Australian
Teacher Workforce Survey, we will gain a better understanding of face-to-face teaching time.
Understanding the breakdown of non-teaching tasks that teachers devote time to in a typical working week is valuable for understanding teacher retention and addressing work stress. By examining the distribution of these tasks and trends over time, systems,
sectors and school leaders can gain insights into the factors that contribute to teacher burnout and job dissatisfaction. Given that we know the impact non-teaching tasks can have on teacher stress, identifying tasks that are consuming too much time
in a teacher’s workload is the first step in addressing such imbalances. Reducing excessive administrative tasks and finding more efficient ways to manage them can alleviate some burden on teachers, leading to improved work-life balance and
reduced work-related stress. Such measures can also enhance time for instruction and student engagement; the aspects of teaching that we know contribute positively to job satisfaction.
While classroom teachers devote most of their work week to face-to-face teaching, it is expected that they undertake other non-teaching tasks such as communicating with parents or lesson planning. Teachers typically devote more time per week outside the
classroom to lesson planning, student supervision and marking than other tasks (Figure 13). For example, 39% of teachers spend 10 or more hours lesson planning per week, and 30% of teachers spend ten or more hours on student supervision. Most teachers
(88%) spend 4 hours or less engaging with parents per week. A notable proportion of teachers spend 5-9 hours (31%) or 10 or more hours (16%) on administrative tasks per week.
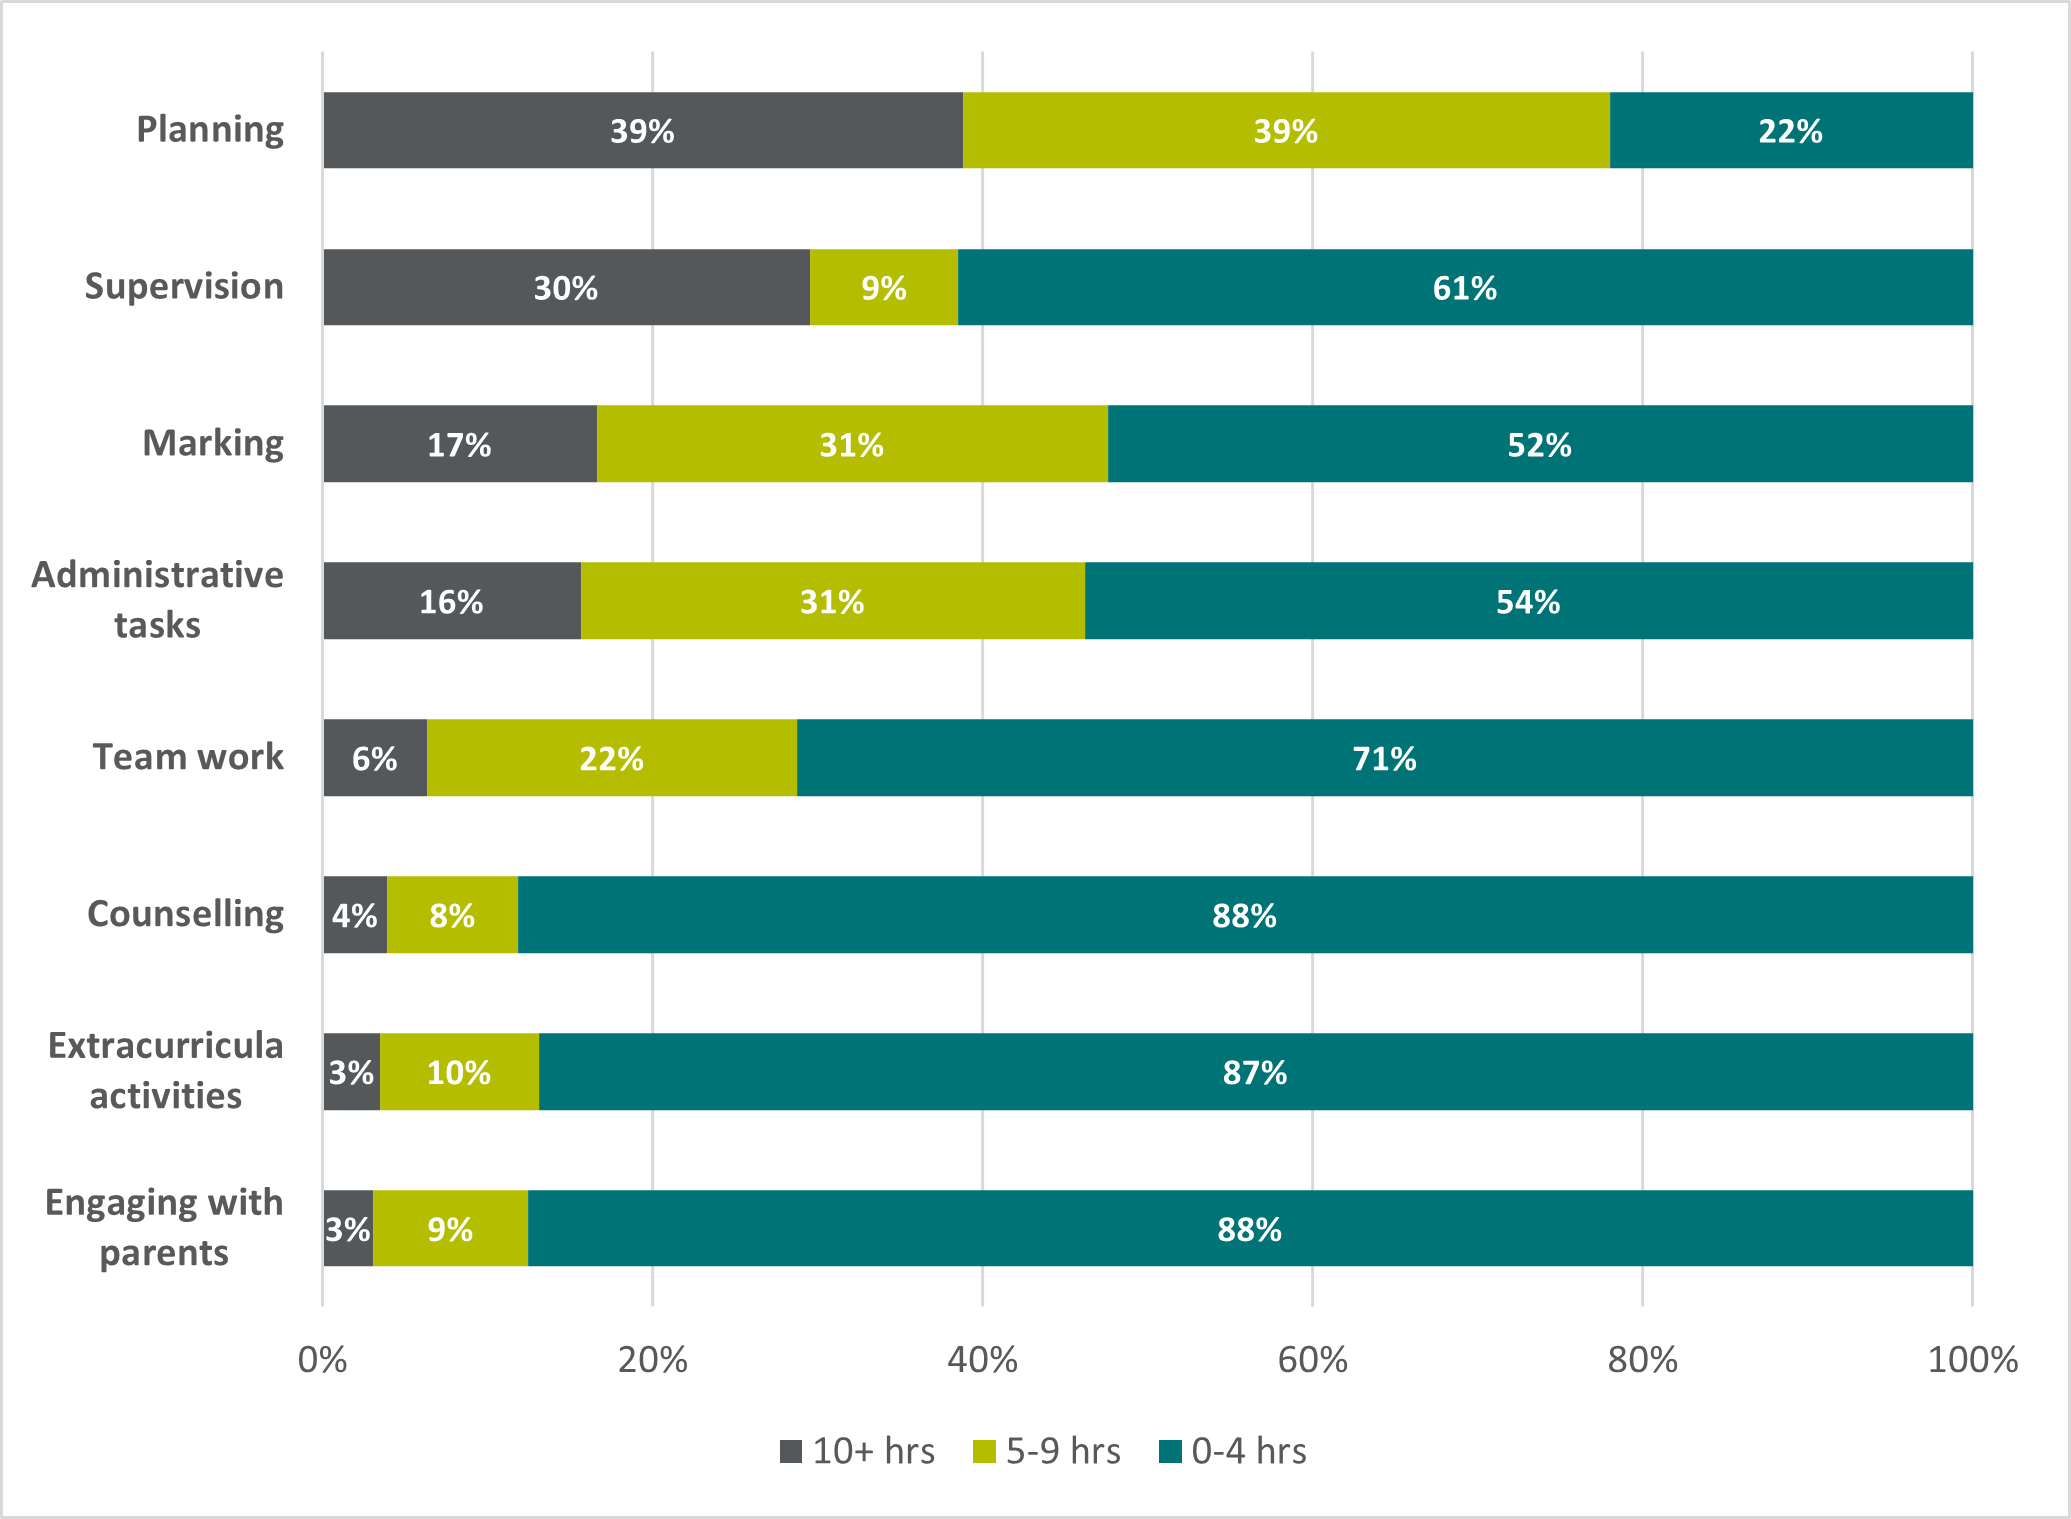 Figure 13: Time spent on non-teaching tasks per week, classroom teachers, 2022
When examined over time, it appears this trend towards administrative tasks consuming more time each week is being increasingly reported by more teachers. Most teachers reported 0-4 hours on administrative tasks in 2019 (62%). This peaked in 2020 (67%)
then dropped to 54% in 2022. In the same period, the proportion of teachers reporting 10 or more hours per week increased from 11% to 16% and those reporting 5-9 hours went from 28% to 31% (Figure 14).
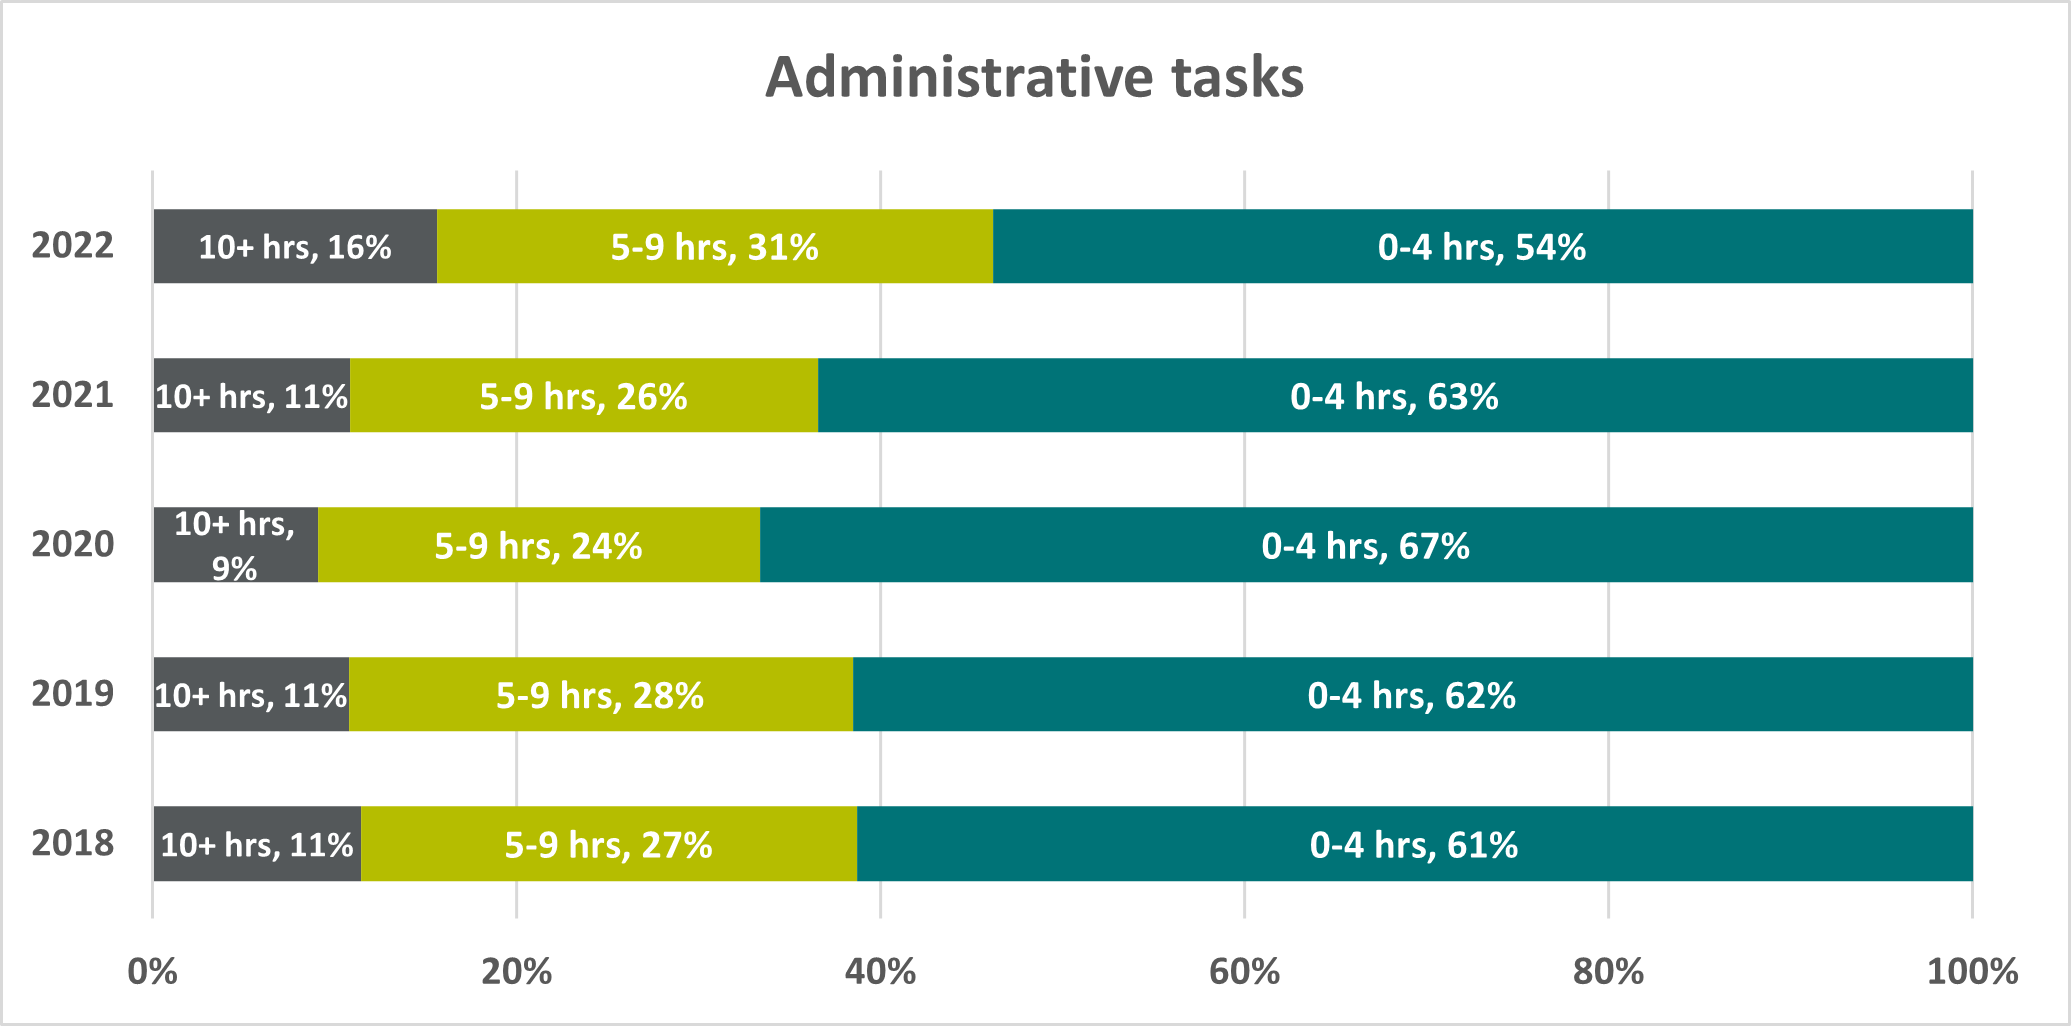 Figure 14: Time spent on administrative tasks by classroom teachers, by year
Nearly two thirds of middle leaders (64%) spend 10 or more hours per week on administrative tasks. Middle leaders also devote time to student interactions (60%, 10 or more hours) and instructional leadership (35%, 10 or more hours).[16]
It appears administrative tasks also consume a large amount of time in a senior leader’s week, with 86% reporting they devote more than 10 hours per week to such duties. Most senior leaders (61%) spend 10 or more hours per week on student interactions.
Instructional leadership also consumes much of a senior leader’s week (56% spend 10 or more hours, 22% spend 5-9 hours). Nearly 60% of senior leaders spend 5 or more hours per week engaging with parents. The time senior leaders typically spend
each week engaging with parents has increased over time. In 2018, more than half (51%) spent less than 4 hours on this per week. In 2022, this dropped by 10 percentage points – now, 59% of senior leaders spend 5 or more hours per week engaging
with parents.
These data largely match the results of the Australian Principal Occupational Health, Safety and Wellbeing Survey, which found that in 2022 principals reported an average of 56.2 hours during the school term and 22.2 hours during school holidays (See
et al., 2023).
The findings presented in this Spotlight provide a snapshot overview of Australia’s teacher workforce. Australian teachers work in a variety of contexts and are highly experienced. Leadership roles become increasingly available as teachers gain
experience in the profession and across all positions in schools, teachers are increasingly likely to be working under ongoing and full-time employment contracts.
While teaching is a valuable and rewarding profession it also has its difficulties. The challenges of teacher retention are considerable, with a substantial proportion of teachers expressing intentions to leave the profession before retirement. However,
there is also a large group of teachers who remain uncertain about their long-term career plans, providing an opportunity to implement retention strategies that can positively impact their decisions.
It is important to recognise that the issues of retention and burnout extend beyond the teaching profession. The broader Australian workforce is experiencing similar challenges, and the COVID-19 pandemic has expedited a re-evaluation of work dynamics
for many workers. While this poses a formidable challenge, it also presents new possibilities. If there is increased mobility in the job market, as people look for new careers, there may be more opportunities to attract new people to the teaching
profession. To capitalise on this opportunity, and to maximise retention, it is vital to leverage available data to gain a comprehensive understanding of the factors affecting the workforce experience of teachers and implement evidence-informed approaches
to improvement wherever possible.
Footnotes
- For an explanation of this calculation see the reverse side of the ATWD Key Metrics Dashboard tile ‘Number of registered teachers, 2020’. In 2020, data was included in the ATWD on 463,117 registered teachers in 7 states and territories participating in the ATWD (AITSL, 2023) – note 2020 registration data for Western Australia was not available. As such, the total number of registered teachers in Australia in all 8 states and territories was projected through modelling based on publicly available data on teacher numbers in WA.',
- The ATWD initially received all demographics from sources other than the Australian Teacher Workforce Survey. When the linked 2022 data is reported, additional demographics, including disability information, Aboriginal and Torres Strait Islander identity, and languages spoken at home will become available for reporting purposes.',
- 2022 Australian Teacher Workforce Survey data is preliminary. Survey data from 2018-2020 has been linked to the other ATWD sources, whereas the survey data for 2021 and 2022 is preliminary and subject to small revisions following linkage.',
- This data is based on survey responses and weighting of the sample to the population has not yet been performed. Therefore, caution should be taken before combining the workforce structure with the calculated size of the registered teacher workforce.',
- Registered teachers who do not have leadership responsibilities and are not leaders; teachers who are employed under permanent/ongoing contracts. Excludes casual/relief teachers.',
- For those working in schools, position indicates the seniority of the highest formal position held (senior leader, middle leader, classroom teacher) and the highest reported role (leader, leader with teaching responsibilities, teacher with leadership responsibilities, and classroom teacher). Those working as casual/relief teachers (CRTs) are also identified in information on contract types.',
- Those formally holding leadership roles such as department heads and assistant principals.',
- Those formally holding leadership roles such as deputy principals, principals and service directors.',
- Full-time equivalent',
- Note, due to differences in survey questions and methodology, the ATWD results and other workforce surveys reported above are not directly comparable.',
- When asked in a yes/no format, which differs from the ATWD, so the results are not directly comparable.',
- Note, with additional years of national, linked data, the ATWD will be able to examine other measures of teacher attrition, such as the proportion of registered teachers who are not registered in any jurisdiction in subsequent years as well as survey responses in multiple years of those who move from the teacher workforce to the non-deployed workforce. As of mid-2023, with only one year of linked data provided by all state and territory teacher regulatory authorities, these data are not discussed here.',
- This excludes WA graduates as no registration data from the respective teacher regulatory authority was available.',
- Excluding WA.',
- The list of reasons for considering leaving teaching was clustered into similar groups. See the ATWD Technical Report for methodological details on this grouping.',
- There is no data on this variable for middle leaders prior to 2021.',
ABS. (2022, May 24). Job mobility, February 2022. https://www.abs.gov.au/statistics/labour/jobs/job-mobility/latest-release
ACARA. (2023). ACARA - Data Access Program. https://acara.edu.au/contact-us/acara-data-access
AITSL. (2021). Technical Report—Supplement to the Australian Teacher Workforce Data: National Teacher Workforce Characteristics Report. https://www.aitsl.edu.au/docs/default-source/atwd/reports/workforce-characteristics-report/technical-report-for-atwd-teacher-workforce-report.pdf
AITSL. (2020). The role of school leadership in challenging times. AITSL. https://www.aitsl.edu.au/research/spotlights/the-role-of-school-leadership-in-challenging-times
AITSL. (2022a). Classroom Management Standards-aligned evidence-based approaches. AITSL. https://www.aitsl.edu.au/research/spotlights/classroom-management-standards-aligned-evidence-based-approaches
AITSL. (2022b). Wellbeing in Australian schools. AITSL. https://www.aitsl.edu.au/research/spotlights/wellbeing-in-australian-schools
AITSL. (2023). ATWD National Trends: Teacher Workforce. AITSL. https://www.aitsl.edu.au/research/australian-teacher-workforce-data/atwdreports/national-trends-teacher-workforce
APNA. (2022). One in four Primary Health Care nurses plans to quit. https://www.apna.asn.au/about/media/one-in-four-primary-health-care-nurses-plans-to-quit
Carroll, A., Forrest, K., Sanders-O’Connor, E., Flynn, L., Bower, J. M., Fynes-Clinton, S., York, A., & Ziaei, M. (2022). Teacher stress and burnout in Australia: Examining the role of intrapersonal and environmental factors. Social Psychology
of Education, 25(2–3), 441–469. https://doi.org/10.1007/s11218-022-09686-7
Department of Education. (2022). National Teacher Workforce Action Plan [Text]. https://www.education.gov.au/teaching-and-school-leadership/resources/national-teacher-workforce-action-plan
EEF. (2023). Teacher quality, recruitment, and retention: Rapid Evidence Assessment. https://d2tic4wvo1iusb.cloudfront.net/documents/Teacher-quality-recruitment-and-retention-lit-review-Final.pdf?v=1686146844
Ellerbeck, S. (2022, June 24). The Great Resignation is not over: A fifth of workers plan to quit in 2022. World Economic Forum. https://www.weforum.org/agenda/2022/06/the-great-resignation-is-not-over/
Health Workforce Australia. (2014). Australia’s future health workforce: Nurses—Detailed report. Hunter, J., & Sonnemann, J. (2022). Making time for great teaching: How better government policy can help. Grattan Institute.
Hurst, D. (2023, May 2). Australia may use defence exchanges with Pacific countries to tackle ADF recruitment crisis. The Guardian. https://www.theguardian.com/australia-news/2023/may/02/australia-may-use-defence-exchanges-with-pacific-countries-to-tackle-adf-recruitment-crisis
MacDonald, L., & Stayner, G. (2022, July 21). Australia facing nursing shortage as more than two years of COVID takes its toll. ABC News. https://www.abc.net.au/news/2022-07-22/nursing-shortage-on-the-cards-due-to-pandemic/101253058
National Skills Commission. (2022). 2022 Skills Priority List: Key Findings Report. https://www.nationalskillscommission.gov.au/sites/default/files/2022-10/2022%20SPL%20Key%20Findings%20Report%20-%206%20October%202022_0.pdf
NSW Department of Education. (2023, June 19). Almost 5500 teachers and support staff accept permanent roles as government acts to address workforce crisis in schools. NSW Government; NSW Government. https://www.nsw.gov.au/media-releases/5500-school-staff-made-permanent
OECD. (2020). TALIS 2018 Results (Volume II): Teachers and School Leaders as Valued Professionals. OECD Publishing. https://doi.org/10.1787/19cf08df-en
OECD. (2023). Education policy outlook in Australia. https://www.oecd-ilibrary.org/docserver/ce7a0965-en.pdf?expires=1692745339&id=id&accname=guest&checksum=A9841300F41EE79408FCD2147FC4F488
PwC. (2021). The future of work: What workers want—Winning the war on talent. https://www.pwc.com.au/important-problems/future-of-work/what-workers-want-report.pdf
Räsänen, K., Pietarinen, J., Pyhältö, K., Soini, T., & Väisänen, P. (2020). Why leave the teaching profession? A longitudinal approach to the prevalence and persistence of teacher turnover intentions. Social Psychology
of Education, 23(4), 837–859. https://doi.org/10.1007/s11218-020-09567-x
Ruppanner, L., Churchill, B., & Bissell, D. (2023, March 20). The “great resignation” didn’t happen in Australia, but the “great burnout” did. The Conversation. http://theconversation.com/the-great-resignation-didnt-happen-in-australia-but-the-great-burnout-did-201173
Ruppanner, L., Churchill, B., Bissell, D., Ghin, P., Hydelund, C., Ainsworth, S., Blackhman, A., Borland, J., Cheong, M., Evans, M., Frermann, L., King, T., & Vetere, F. (2023). State of the Future of Work 2023. The University of Melbourne. https://static1.squarespace.com/static/633114f1cc72f51e29fbef8a/t/6413d9f5862abf22f9b6eb1f/1679210018394/StateoftheFutureofWork_2023.pdf
Sebastian, J., Aguayo, D., Yang, W., Reinke, W. M., & Herman, K. C. (2023). Single-Item Principal Stress and Coping Measures: Concurrent and Predictive Validity and Comparisons to Teacher Measures. School Psychology, Advance online publication.
https://dx.doi.org/10.1037/spq0000555
See, S.-M., Kidson, P., Marsh, P., & Dicke, T. (2023). The Australian Principal Occupational Health, Safety and Wellbeing Survey (IPPE Report). Institute for Positive Psychology and Education, Australian Catholic University. https://www.healthandwellbeing.org/reports/AU/2022_ACU_Principals_HWB_Final_Report.pdf
Sutton, J. (2022, August 15). Understanding the Great Resignation in Australia 2022. Access. https://www.theaccessgroup.com/en-au/blog/hcm-the-great-resignation-australia/
UNSW. (2022). Are we seeing the Great Resignation—Or the Great Exhaustion? Inside UNSW. https://www.inside.unsw.edu.au/social-impact/are-we-seeing-the-great-resignation-or-the-great-exhaustion