About this publication
Publication details
The key national trends
- A 19% drop in commencements was observed in 2018, more so amongst older ITE students likely to be changing careers
- The number of ITE completions in 2019 was at its lowest since 2005
- All program types experienced decreases in completion rates with primary programs seeing the largest decline
- First-year attrition rates reached their highest levels in 2018
- While many factors may also be impacting, a drop in the completion rate for postgraduate primary programs coincides with the gradual national change to two-year programs which peaked in 2018
- Higher education is the most common basis on which ITE students gain admission into ITE courses
- Some student groups seem to be more at risk of not completing ITE programs
- ITE students are increasingly likely to opt for flexible study modes (online and multi-modal)
- Multi-modal programs may increase the likelihood of students completing ITE programs
- Changes in the uptake of online and multi-modal courses will impact the accuracy in estimating teacher supply in individual states and territories
- Efforts to increase teacher supply will need to take account of the different pathways taken by primary, secondary and early childhood teachers
Learn more about the Australian Teacher Workforce Data Initiative
Overview
The ATWD National Trends: Initial Teacher Education (ITE) pipeline provides insight into emerging national trends in the supply of teachers through ITE. It contains interpretations of key national trends from 2005 to 2019, situated within a policy context or noting policy shifts or changes that could have an impact on the data. This publication raises important questions and considerations for policy makers about factors affecting the available teacher supply pool in Australia.
Note: Throughout the publication, further detail can be accessed through the hover text function, which provide (i) further definitions and descriptions of key terminology or (ii) additional data to support the analysis.
The ITE data in the ATWD is derived from annual data collected as part of the Higher Education Student Data Collection. To date, the ATWD has released ITE data up to 2019 through its Key Metrics Dashboard (KMD). Analysis and interpretation of data up to 2019 provides a valuable picture of the ITE pipeline prior to the COVID-19 pandemic. This provides a baseline for future analysis of changes in the ITE pipeline, post-COVID.
The ATWD National Trends: ITE pipeline publication will be updated annually as new data is released in the KMD. A separate ATWD National Trends: Teacher Workforce publication will provide insight into national trends in the teacher workforce and will also be updated annually.
The ATWD National Trends publications are written to support workforce planning and inform decision-making by increasing awareness and understanding of notable national trends from population data. For further information on jurisdictional differences, stakeholders are encouraged to explore the data available on the KMD.
What is the ITE pipeline?
The ITE pipeline focuses on the start of the professional journey of most teachers: from commencement to completion of an accredited initial teacher education program through a higher education provider. This stage precedes provisional registration and entry into the teacher workforce.
Using ATWD data to gain a better understanding of the profile of new and emerging graduates, as well as the factors that lead to their successful completion of ITE programs, facilitates a more nuanced approach to identifying policy opportunities that can affect change and strengthen the overall supply of high-quality teachers into the workforce.
ITE pipeline summary
ITE pipeline trends (2005-2019)
Commencements
The key national trends in commencements
- A 19% drop in commencements was observed in 2018, more so amongst older ITE students likely to be changing careers
- Efforts to increase teacher supply will need to take account of the different pathways taken by primary, secondary and early childhood teachers
- ITE students are increasingly likely to opt for flexible study modes (online and multi-modal)
- Higher education is the most common basis on which ITE students gain admission into ITE courses
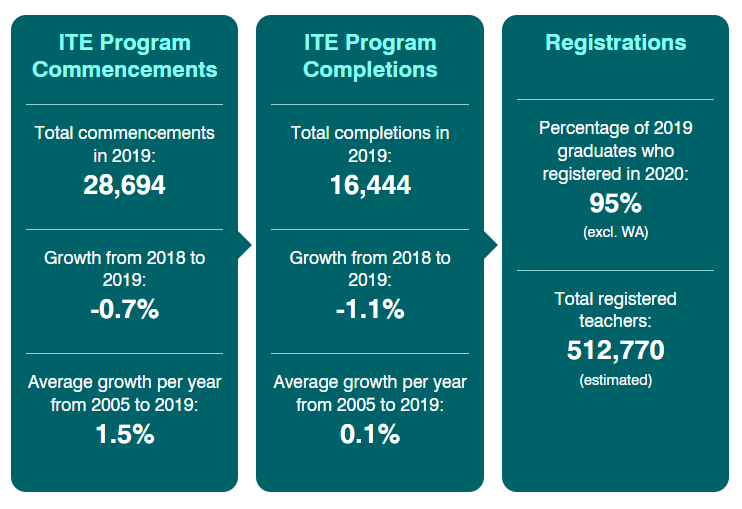
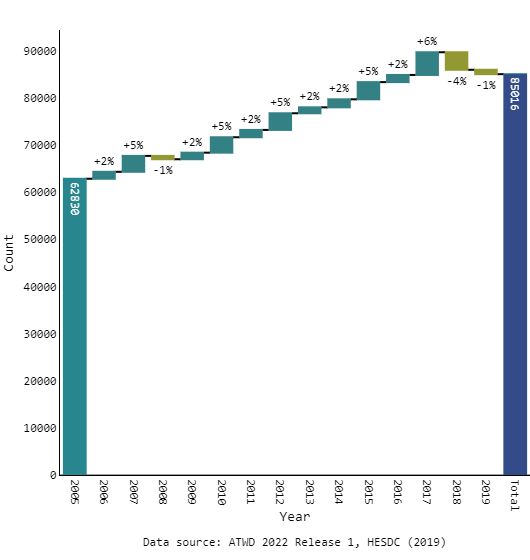
Trends in commencements are a tale of two time periods – recording a growth from 2005 to 2017, and a decline from 2018 to 2019. Patterns of commencements in ITE programs across Australia have shown an average growth of 1.5% per year from 2005 to 2019. However, the number of ITE commencements fell by 19% from 2017 to 2018 and did not bounce back in 2019, falling a further 1% to its lowest point since 2009.
| Total commencements 2019 | 28,694 |
| 2018 – 2019 change | -0.7% |
| Past 5 years average change per year | -3.4% |
| 2005 – 2019 average change per year | +1.5% |
A 19% drop in commencements was observed in 2018, more so amongst older ITE students likely to be changing careers.
A sharp decline in ITE program commencements was experienced between 2017 and 2018 which did not reverse in 2019.
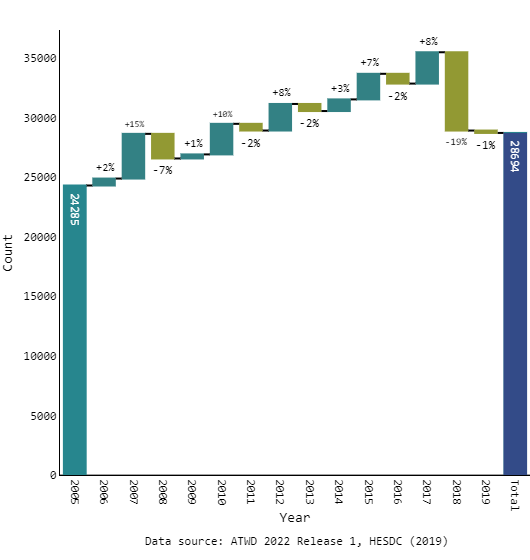
The drop in commencements from 2017 to 2018 will have impacted new teacher supply initially from 2020, as the majority of postgraduate completions come after two years of study, then in 2022, as the majority of undergraduate completions come after four years of study. Any improvement to commencement numbers in 2020 and 2021 will take a similar amount of time to flow through the pipeline and positively impact workforce supply.
Undergraduate commencements and postgraduate commencements fell by almost the same rate from 2017 to 2018. As undergraduate commencements comprised a much larger proportion of the commencing cohort in 2018, the overall decrease in the number of commencements was largely the result of a decrease in undergraduate commencements. The drop in commencements in 2018 was entirely driven by decreasing decreasing domestic student commencements as international ITE commencements increased by 7% for that period. By 2018, one-year postgraduate programs had been phased out nationally and all new postgraduate program commencements were in two-year programs. However, there is little evidence to suggest that this was the only contributing factor to the commencement decline, as undergraduate commencements fell even faster.
(a) Attracting mid-career changers and ensuring they enter the workforce.
A greater drop in commencements was experienced by groups typically associated with mid-career entry into ITE. The demographic and study attributes of students who experienced greater declines from 2017 to 2018 were those:
- aged 31 or older.
- who commenced online programs.
- who commenced programs part-time.
- from metropolitan areas.
| Domestic | -20% | vs | 7% | International |
| Aged 31 or older | -31% | vs | -14% | All other ages |
| Online | -29% | vs | -15% | On-campus & multi-modal |
| Part-time | -31% | vs | -15% | Full-time |
| Metropolitan | -22% | vs | -11% | Regional / Remote |
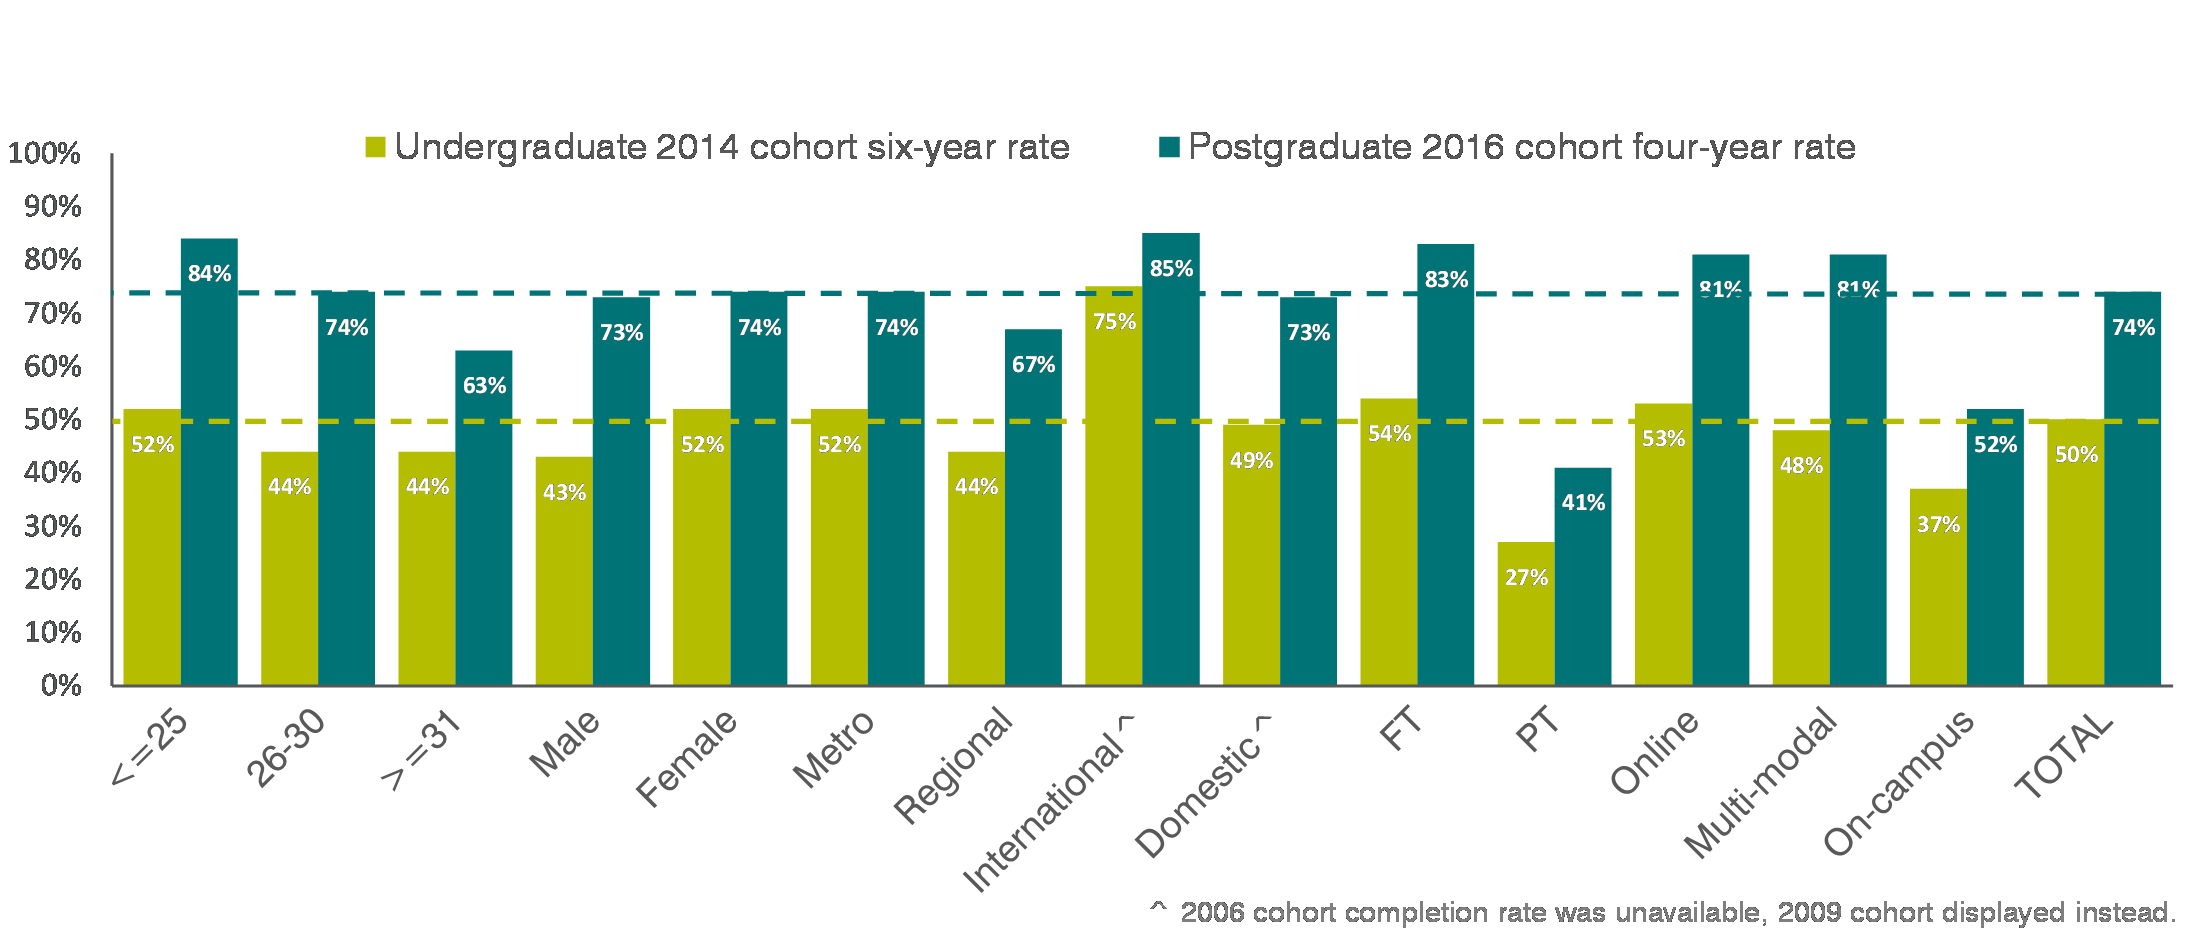
These groups are also those who tend to have lower completion rates (Table 3). Given this, the impact of the drop in commencements in these groups is likely to have a smaller overall impact on graduate numbers and teacher supply in the current pipeline from 2020. However, decreasing attraction of students who have the characteristics associated with mid-career change to ITE courses has important implications for both the diversity of the workforce and for successful attraction and graduation of mid-career changers in order to address supply shortages.
| Undergraduate completion rates * | Postgraduate completion rates * | ||||||||
|---|---|---|---|---|---|---|---|---|---|
| 31 years or older | 44% | vs | 48% | All other ages | 31 years or older | 63% | vs | 79% | All other ages |
| Online | 37% | vs | 51% | On-campus and multi-modal | Online | 52% | vs | 81% | On-campus and multi-modal |
| Part-time | 27% | vs | 54% | Full-time | Part-time | 41% | vs | 83% | Full-time |
| Domestic | 49% | vs | 75% | International | Domestic | 73% | vs | 85% | International |
| Metropolitan | 52% | vs | 44% | Regional / Remote | Metropolitan | 74% | vs | 67% | Regional / Remote |
Efforts to increase teacher supply will need to take account of the different pathways taken by primary, secondary and early childhood teachers.
Historically, undergraduate programs have had a larger proportion of primary ITE students than secondary ITE students, and postgraduate programs have had a larger proportion of secondary ITE students than primary. With this pattern of commencements observed across learner levels the impact of policy interventions targeting postgraduate or undergraduate programs would have had asymmetric outcomes on teacher supply across learner levels (the early childhood, primary and secondary workforce), depending on the degree level at which the policy intervention is primarily targeted.
Since 2005, this pattern has changed, with the gap in primary and secondary commencements decreasing across both undergraduate and postgraduate programs.
- Undergraduate ITE students - by 2019, 39% of undergraduate ITE students were commencing in primary programs, a decrease of 6 percentage points, while 34% were commencing in secondary programs an increase of 6 percentage points (2005: 46% primary, 28% secondary).
- Postgraduate ITE students - by 2019, fewer than half (47%) of postgraduate ITE students were studying secondary teaching, a decrease of 18 percentage points from 2005, while 29% were commencing primary programs in 2019, an increase of 9 percentage points (2005: 65% secondary; 21% primary).
The proportion of early childhood commencements has increased for both undergraduate programs (+5 percentage points) and postgraduate programs (+8 percentage points) due to an overall increase in the numbers studying early childhood.
It is important to note, within program types, a change in the degree levels studied was seen mostly in primary and early childhood.
- Within secondary programs, the proportion of secondary program commencements by undergraduate ITE students was consistently around 60% from 2005 to 2019.
- Within primary programs, a greater proportion of ITE students were commencing at the postgraduate level in 2019, while the majority were still studying at the undergraduate level (75%).
- Within early childhood programs, a greater proportion of ITE students were commencing at the postgraduate level in 2019 while the majority were still studying at the undergraduate level (78%).
There remains some asymmetry in how policy interventions targeting differing degree levels will impact supply for the different learner levels. The relative contribution of ITE students going through both undergraduate and postgraduate programs into the ITE supply pipeline provides critical insights that could inform ITE program recruitment strategies.
| Early Childhood | Primary | Secondary | Mixed/other | |
| Proportion of Undergraduates | ||||
| 2005 | 13% | 46% | 28% | 14% |
| 2019 | 18% | 39% | 34% | 9% |
| Percentage Point Change | +5 | -6 | +6 | -4 |
| Proportion of Postgraduates | ||||
| 2005 | 3% | 21% | 65% | 11% |
| 2019 | 11% | 29% | 47% | 13% |
| Percentage Point Change | +8 | +9 | -18 | +2 |
ITE students are increasingly likely to opt for flexible study modes (online and multi-modal).
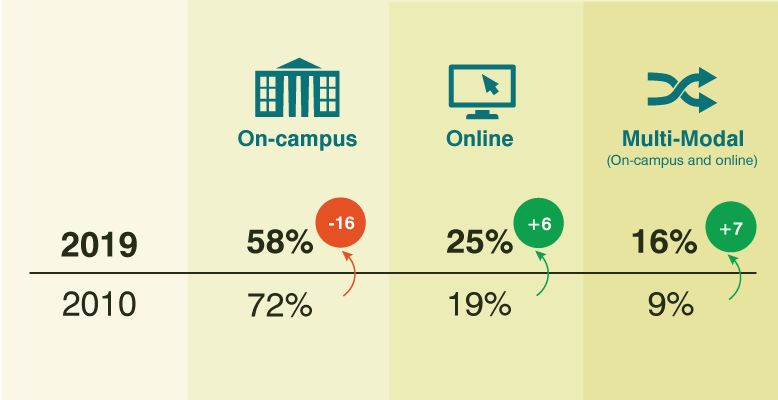
Though programs delivered on campus are still the most popular choice for commencing ITE students, online and multi-modal programs have steadily increased in popularity, with over 40% of all commencements undertaking these modes of study in 2019.
The increase in students opting for non-traditional study modes is likely to be due to both evolving preferences for flexibility of study but also the increasing availability and quality of such programs offered by higher education providers. With more ITE students looking at alternative modes of study other than traditional on-campus programs, it will be important for ITE providers and related decision-makers to consider the design, delivery and relative proportion of ITE programs through different modes of delivery. Considering this will ensure students are attracted into the most appropriate modes of delivery of programs based on their individual study needs, that programs are fit-for-purpose for the mode of delivery and student type and that they provide sufficient support to retain students through to completion.
Further shifts away from commencing study on campus could be a positive change – potentially attracting more students – or a potential risk to supply, depending on the yield of off-campus programs; their completion rate and rate of transition into the workforce. If the likelihood of completion for online, multi-modal and on-campus study are similar, a shift to increased online and multi modal delivery of ITE programs would not impact teacher supply. However, current data trends indicate that ITE students commencing online are less likely to complete their studies and so a shift to more online program delivery with no improvement in the completion rates for those programs is likely to reduce the numbers of students ultimately completing. On the other hand, multi-modal completion rates are higher than online completion rates, suggesting that this mode of delivery may be more successful in meeting student needs and could be increasingly important in contributing to teacher supply through the ITE pipeline.
Further investigation is needed into the criteria for successful delivery of ITE programs provided fully or partially off campus, as well as the provision of support mechanisms for ITE students with flexible study arrangements.
More detailed analysis on multi-modal completion rates, and online completion rates are available in the sections below.
(a) Part-time students are increasingly looking for flexible study arrangements.
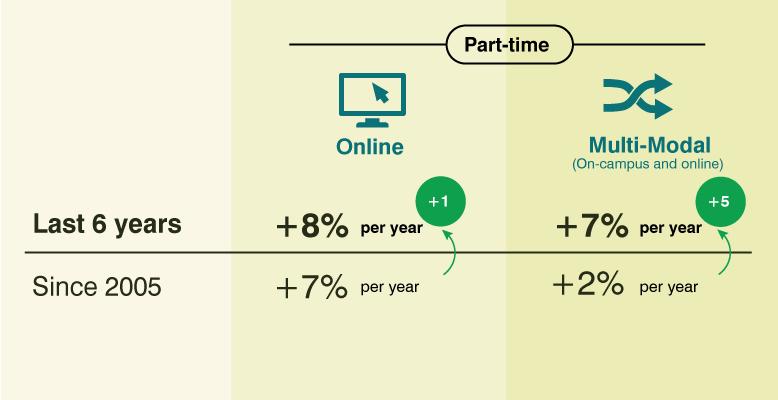
Part-time students are increasingly likely to opt for flexible study arrangements, with the pace of growth increasing in recent years. In 2019, online was by far the most popular study mode for part-time students, attracting 65% of part-time commencements, compared to multi-modal (7%) and on-campus (28%) modes. While multi-modal programs still accounted for less than 7% of part-time commencements, the pace of growth in these programs for part time students is accelerating.
- Part-time commencements in multi-modal programs have been growing at an average of 2% per year from 2005, and subsequently increased to an average of 7% per year from 2014 to 2019, mirroring the total rate of growth for part-time online programs since 2005.
- Part-time online commencements increased on average by 7% per year since 2005, with the pace of growth increasing slightly to an average of 8% per year from 2014 to 2019.
(b) Full-time students are still seeking flexible study arrangements but the pace of growth is slowing
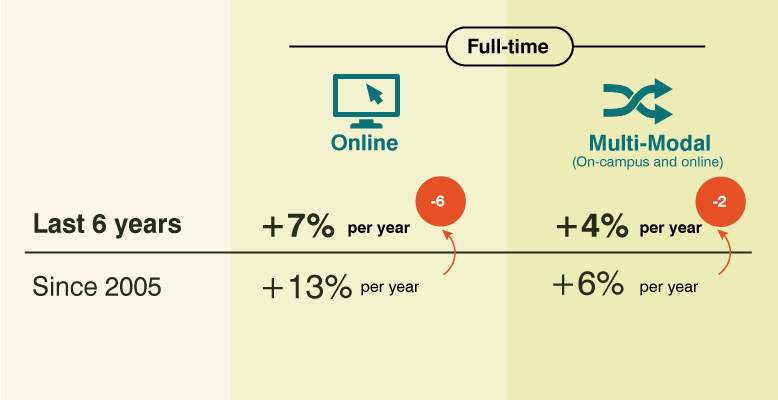
Full-time students were increasingly likely to opt for flexible study arrangements by opting to commence programs that are offered through online or multi-modal study modes. However, the pace of growth for this trend has slowed (see Figure 4).
- Online full-time commencements became more popular, increasing an average of 13% per year since 2005. However, the rate of growth had slowed from 2014, increasing at an average of 7% per year for full-time students from 2014 to 2019.
- Multi-modal programs also recorded slowing growth amongst full-time commencements.
Higher education is the most common basis on which ITE students gain admission into ITE courses.
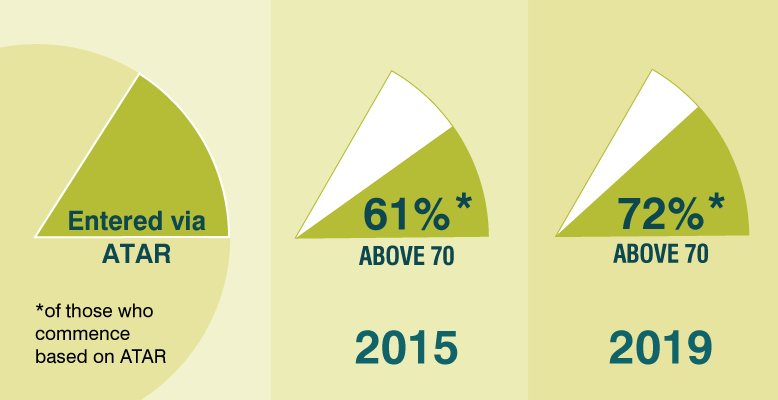
In 2019, 16% of all admissions were on the basis of a recorded ATAR. This has remained steady since 2015, but progressively decreased from 2005-2015. ATAR is only a basis of admission for undergraduate programs. Admissions on the basis of a recorded ATAR was 23% of all undergraduate admissions.
Of those entering on the basis of a recorded ATAR, from 2015 to 2019 there was an increase in the proportion of those with an ATAR of 70 or more (72%) while there was a decrease in the proportion with an ATAR below 60 (8%).
Higher education was a more common route into all ITE programs in 2019, across both undergraduate and postgraduate programs. In 2019, of those entering on the basis of a recorded ATAR 20% had an ATAR of between 60 and 69.
Completions
Key national trends in completions and completion rates
- The number of ITE completions in 2019 was at its lowest since 2005
- All program types experienced decreases in completion rates with primary programs seeing the largest decline
- While many factors may also be impacting completion rates, a drop in the completion rate for postgraduate primary programs coincides with the gradual national change to two-year programs which peaked in 2018
- First-year attrition rates reached their highest levels in 2018
- Multi-modal programs may increase the likelihood of students completing ITE programs
- Some student groups seem to be more at risk of not completing ITE programs
Growth in the overall number of available ITE graduates, which is the number of completions per annum, has not kept pace with growth in the school-aged population, particularly in primary and early childhood programs.
Analysing trends in ITE completions provides an accurate indicator of short-term future supply by looking at the number of new teachers leaving the ITE pipeline. Examining completions by state and territory, and analysing the characteristics of completions, reveals where the potential supply of new teachers through ITE are likely to be deployed, who they are, and what they have studied prior to entering the workforce.
| ITE completions | 2005 | 2019 | Annual Growth | Student Population | 2005 | 2019 | Annual Growth |
| All ITE^ | 16,526 | 16,644 | 0.1% | 3-18 years | 4,317,094 | 4,980,335 | 1.0% |
| Early Childhood Education | 1,781 | 2,096 | 1.6% | 3-4 years | 514,100 | 638,342 | 1.6% |
| Primary Education | 6,740 | 6,327 | -0.4% | 5-12 years | 2,148,239 | 2,569,436 | 1.3% |
| Secondary Education | 6,344 | 6,488 | 0.4% | 13-18 years | 1,654,755 | 1,772,557 | 0.5% |
^Mixed/other programs included in all types 2005: 1,661; 2019: 1,733; Annual growth: 0.9%.
Student population data based on ABS Quarterly Population Estimates (ERP), by State/Territory, Sex and Age.
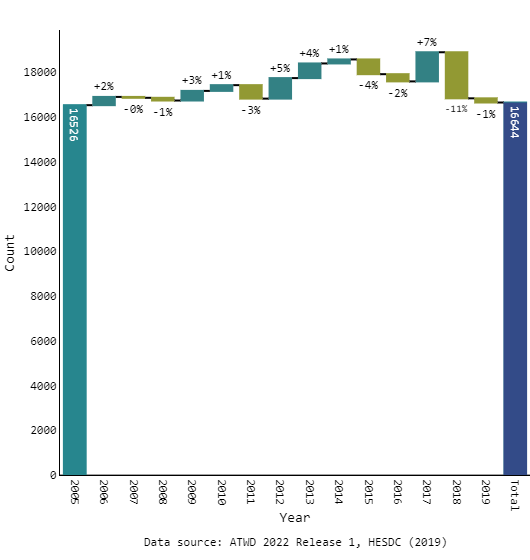
The number of ITE completions in 2019 was at its lowest since 2005.
The number of ITE completions for 2019 was only 0.7% higher than in 2005, making it the lowest point for ITE completions in 14 years. Despite gradual increases in completions across 2005 to 2017, a sharp drop of 11% in 2018 reversed the level of completions in that year to levels similar to 2005; this did not bounce back in 2019.
The number of undergraduate completions fell steadily from 2005 to 2019 with a 7 percentage point drop over that period. Postgraduate completions started falling in 2017 with a marked and substantial decline of 20 percentage points from 2017 to 2019. This coincided with a fall in the proportion of postgraduates completing in their first year.
The marked decline in postgraduate completions has likely been influenced by a range of factors, including the characteristics of the students and the modes of study chosen by the cohort completing in this time frame. For example, for postgraduate ITE students there was a 6 percentage point increase in the proportion of enrolled online between 2010 and 2015 for whom completion rates are lower. However, it is also notable that this marked drop in completions and first-year attrition occurred in tandem with policy shifts resulting in the lengthening of postgraduate program durations from 1 to 2 years.
Completion rates
All program types experienced decreases in completion rates with primary programs seeing the largest decline.
All program types experienced falls in completion rates. However, the largest decreases were seen in primary ITE program completions and, in particular, primary postgraduate programs.
- The largest decrease was observed in primary postgraduate programs, making it the program type with the lowest completion rate amongst all postgraduate programs.
- Of all undergraduate programs, completion rates for primary undergraduate programs saw the largest decrease, compared with the other undergraduate program types (see Table 6).
- Early childhood undergraduate programs fell at a slower pace but had the lowest completion rate (49%) amongst undergraduate programs.
Completion rates
When discussing completion rates, a combination of six-year completion rates for undergraduate programs and four-year completion rates for postgraduate programs are used; this reflects the point by which almost all students have completed their studies or exited the program for undergraduate and postgraduate respectively. In the most recent cohorts, just 3% of students were continuing with their study after these six-year and four-year windows. With current data available up to 2019, six-year completion rates for undergraduate courses can be reported for those commencing up to 2014, while four-year completion rates for postgraduate courses can be reported up to 2016.
| Undergraduate | Postgraduate | |||||
| 2005 | 2014 | Percentage point change | 2005 | 2016 | Percentage point change | |
| Early Childhood | 55% | 49% | -6 | 81% | 70% | -9 |
| Primary | 67% | 52% | -15 | 89% | 66% | -23 |
| Secondary | 60% | 51% | -9 | 86% | 79% | -7 |
While many factors may also be impacting completion rates, a drop in the completion rate for postgraduate primary programs coincides with the gradual national change to two-year programs which peaked in 2018.
While the completion rates for other program types saw relatively steady declines from 2005 to 2016, a steep and sudden drop of 11 percentage points was observed for completion rates in postgraduate primary programs from 2014 to 2015, which did not bounce back thereafter.
As noted above, the decline in postgraduate completions and completion rates has likely been influenced by a range of factors with competing effects including the characteristics of the students and the modes of study chosen by the cohort completing in this time frame or changes to program offerings. Additionally, this analysis is at the national level and policy changes are rolled out gradually and differently across states and territories.
However, the timing of this drop seems to coincide with the phasing out of one-year ITE postgraduate programs to two years. While this change was gradually implemented for primary programs from 2013 to 2018, a large transition to two-year postgraduate primary programs occurred in 2015. The impact of this transition was initially observed as a drop in one-year completion rates for postgraduate primary programs from the 2015 cohort onwards. This trend was then seen to continue with a drop in two-year and four-year completion rates from the 2015 cohort onwards.
- Prior to 2015, one-year completion rates for postgraduate primary programs were approximately 30%. This fell to approximately 10% from 2015.
- Prior to 2015, two-year completion rates for postgraduate primary programs were approximately 70%. This fell to approximately 50% from 2015.
- Prior to 2015, four-year completion rates for postgraduate primary programs were approximately 80%. This fell to approximately 67% from 2015.
A similar pattern was observed in postgraduate secondary programs commencing in 2018 which coincided with a large transition to two-year program durations in that year. This shift was followed by a drop in one-year and two-year completion rates for postgraduate secondary programs.
- Prior to 2018, one-year completion rates for postgraduate secondary programs were approximately 30%. This fell to approximately 8% from 2018.
- Prior to 2018, two-year completion rates for postgraduate secondary programs were approximately 65%. This fell to approximately 55% from 2018.
- The pattern seen in primary programs suggests that the four-year postgraduate secondary program completion rates will likely be lower than in previous years. Four-year completion rate data for postgraduate secondary programs will be available once 2021 data is released.
In future years, with further analysis and investigation, it can be determined with greater certainty the correlation between the duration of ITE programs and its impact on program four-year completion rates. This may also allow investigation of the supports that can increase completion rates in these programs.
First-year attrition rates reached their highest levels in 2018.
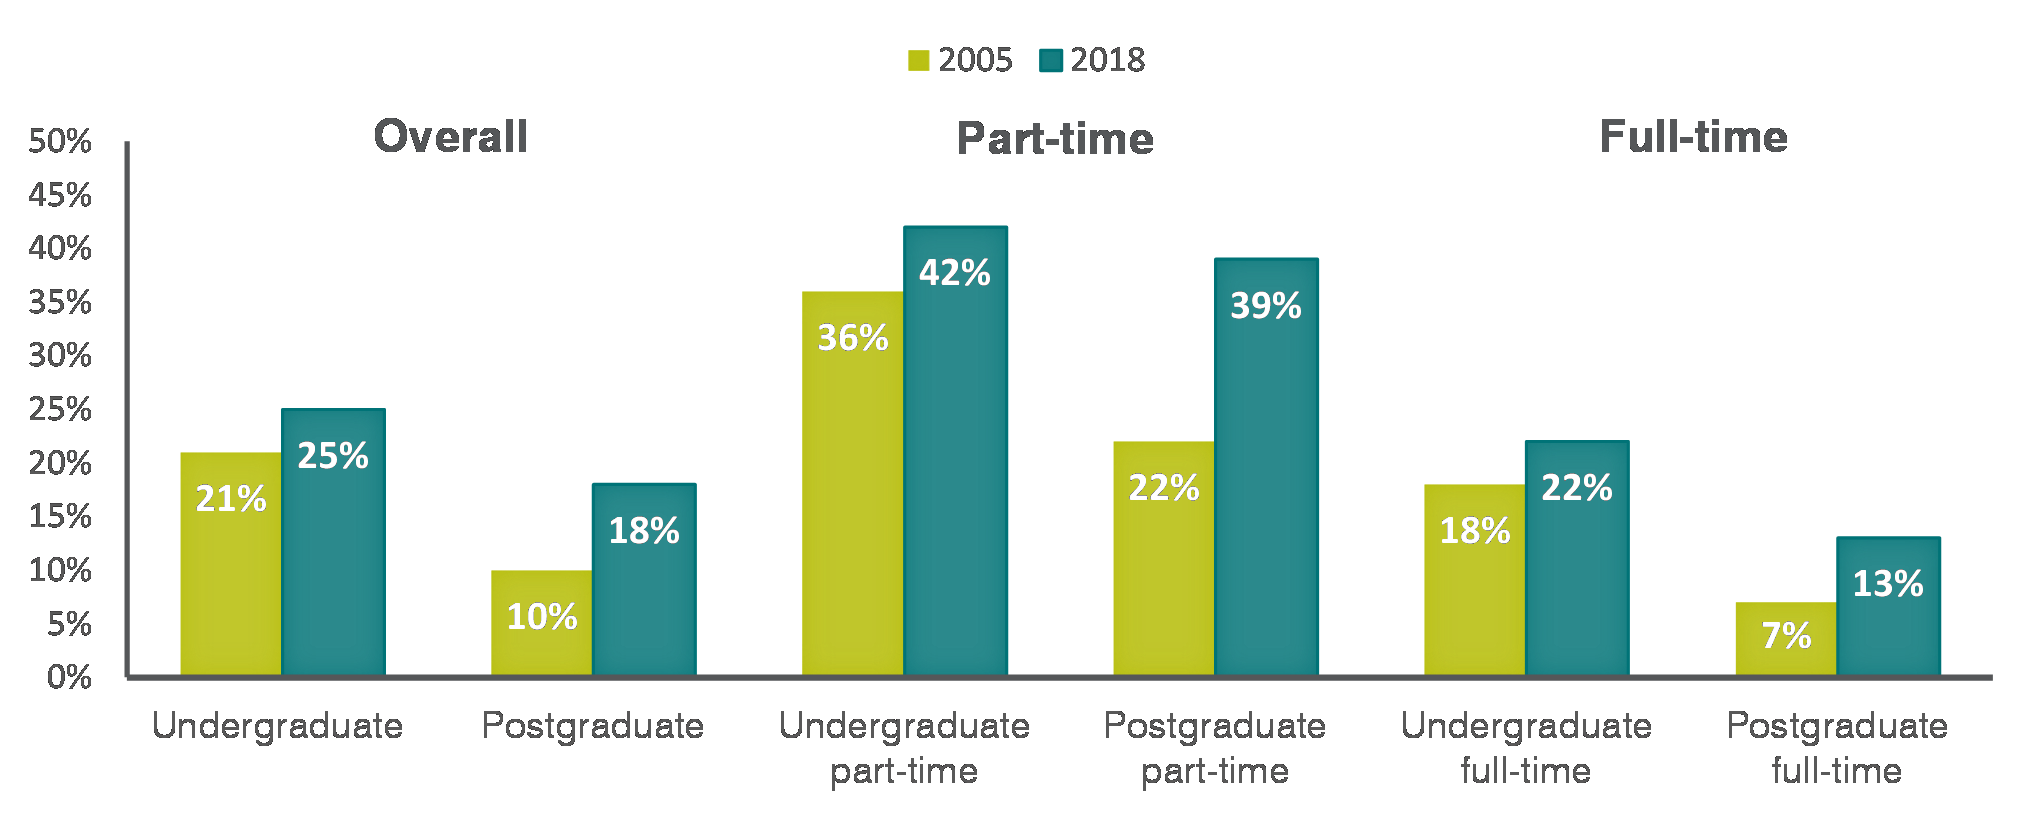
First-year attrition rates have been increasing consistently since 2005 for both full-time and part-time students, undergraduate, and postgraduate programs with first-year attrition rates peaking in 2018 (See Figure 8).
Any increase in first-year attrition will negatively impact future completion rates. With the highest ever postgraduate first-year attrition rates observed in 2018, it is likely that the completion rates for the 2018 commencing postgraduate cohort will be lower than in previous years. Taken together with the overall drop in commencements in 2018, the higher first-year attrition rate is likely to further strain teacher supply from 2020 onwards.
Multi-modal programs may increase the likelihood of students completing ITE programs.
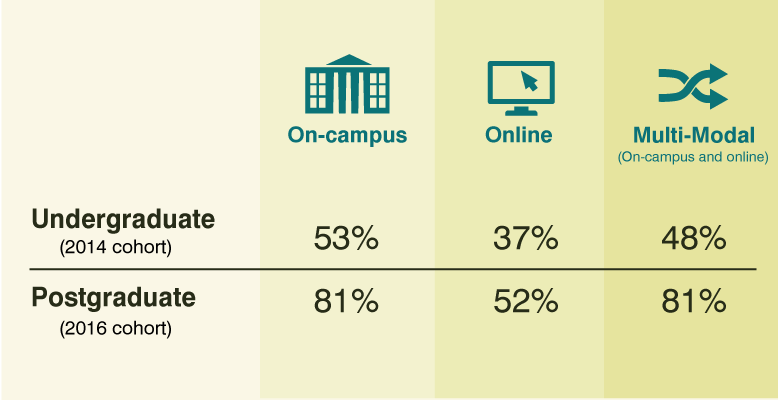
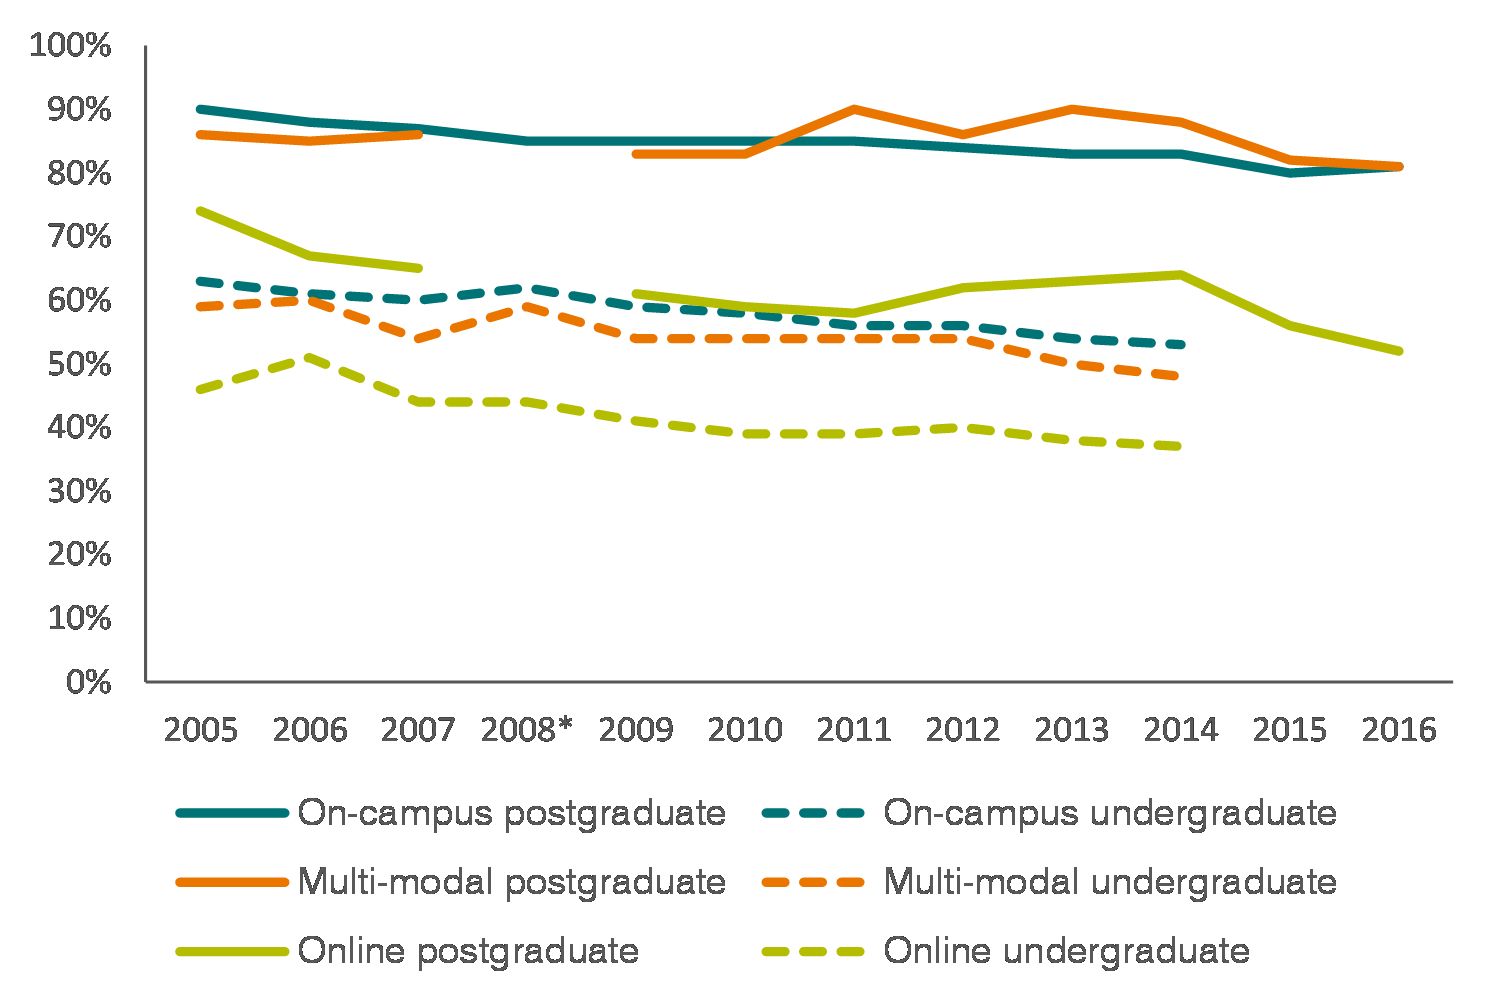
Four-year completion rates for multi-modal postgraduate programs, for ITE students commencing in 2016, were comparable or higher than the completion rates for programs delivered on campus or online. For undergraduate programs, multi-modal completion rates have consistently been higher than those for online courses and almost equal to on-campus completion rates.
This data suggest that some on-campus study is associated with higher chances of completion than online study alone. While it is important to note that not all students will be able to undertake multi-modal study, and that online study is an important provision, with the right support mechanisms in place, multi-modal study may be an attractive and successful mode of study for prospective students.
When paired with the growth in students commencing multi-modal ITE programs the data suggests that multi-modal programs may be both increasingly appealing to prospective ITE students and more successful in ensuring completion of study, moving graduates into the supply pipeline. ITE program offerings will need to keep pace with the evolving needs and preferences of incoming ITE students through the provision of purpose-designed, flexible modes of study and program delivery.
Some student groups seem to be more at risk of not completing ITE programs.
Individuals enrolled in ITE programs may encounter obstacles to completion that, if unsupported, could result in their early withdrawal or discontinuation of study. This would have adverse effects on yield from ITE programs and, ultimately, supply into the workforce to meet teacher demand. By analysing the patterns seen in completion rates, we can begin to identify the characteristics of students most at risk of non-completion and the areas in which additional support may be most required.
Previous analysis of completion rates has shown that failure to complete online study covaries significantly with demographic variables also associated with low completion rates. For example, those studying online are more likely to be part-time and/or mature-aged and/or from regional/remote areas. These factors may contribute as much, if not more, to a student's likelihood of completion as their mode of study.
Further analysis of longitudinal data from subsequent ATWD collections is required to provide definitive insight into the covariance of mode of study and student characteristics on completion of ITE. However, current data provides further insight into the student risk factors.
(a) Students commencing ITE at 31 years of age or older are less likely to complete ITE programs.
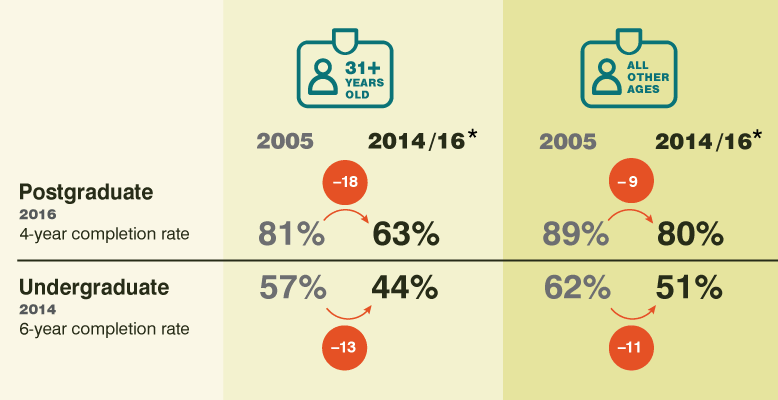
ITE students 31 years or older were less likely to complete their ITE program than all other age groups, and experienced a steeper rate of decline in completions for these students over time (Figure 10). This was true for both postgraduate and undergraduate programs.
- The completion rate for postgraduate programs for those 31 years or older who commenced in 2016, was 17 percentage points lower than all other age groups, while undergraduate completion rates for those 31 years or older who commenced in 2014 was 7 percentage points lower.
- From 2005, the rates of completion for postgraduate programs for those over 31 years recorded a steeper decline (-18 percentage points) than all other age groups (-9 percentage points), with the trend being mirrored to a lesser extent for undergraduate completion rates (see Figure 14).
A number of other characteristics that are also associated with lower completion rates tend to be more common amongst ITE students aged 31 years or older than other age groups. Specifically, those aged 31 years or older are more likely to undertake their courses part-time through online modes of study. There are a number of possible reasons for this. These students could be making a mid-career change, may need to balance their ITE study commitments with family commitments, or may have pre-existing financial commitments that requires them to combine study with paid work. Investigating this further may allow targeted support to be provided for this group, which could improve their likelihood of completion and inform policy interventions aimed at attracting mid-career changers.
(b) Students studying online have the highest risk of non-completion.
In 2019, ITE students studying online experienced the lowest completion rates, with this mode of delivery recording much lower completion rates than other modes of study. The difference in completion rates for online programs compared to other modes of program delivery was at its highest for postgraduate degree levels.
- Postgraduate online programs had a four-year completion rate of 52%, 29 percentage points lower than the completion rate for multi-modal (81%) and on-campus programs (81%).
- Undergraduate online programs had a six-year completion rate of 37%, 11 percentage points lower than the completion rate for multi-modal programs (48%) and 17 percentage points lower than the completion rate for on-campus programs (53%).
The lower completion rates for postgraduate programs do not seem to be caused by a higher proportion of part-time enrolments who remain enrolled after 4 years. The proportion of students still enrolled by their fourth year was only around 5%, suggesting that completion rates will not markedly improve even once all remaining enrolments complete.
*2008 data unavailable for online and multi-modal postgraduate courses due to small cell sizes.
(c) Part-time students tend to be more at risk of non-completion than full-time programs.
Part-time students have consistently recorded lower completion rates than full-time students, however this gap has widened for postgraduate programs from 23 percentage points in 2005 to 41 percentage points in 2019.
The deterioration in the completion rate has a major impact on supply. Part-time students made up 19% of commencements in 2019 and a large proportion of those taking up part-time study were over the age of 31 and/or studying online.
Citations
- ‘Commencements’ refer to the cohort of students beginning study in ITE and entering the ITE pipeline. Commencements provide an early indication of potential supply overall, and through different types of ITE programs and providers. The number of commencements will not indicate actual teacher supply into the workforce. Actual teacher supply will be mediated by the number of students who complete and go on to register.
- undergraduate: -20%; postgraduate: -14%
- undergraduate commencements: 70%, postgraduate commencements: 30%
- -20%, 2017, 33,817; 2018: 27,134
- The Standards and Procedures for the accreditation of ITE programs introduced in 2011 stipulate the requirement that ITE program structures: “Comprise at least two years of full-time equivalent professional studies in education and be structured so that a graduate has undertaken a four-year or longer full-time equivalent program(s) that leads to a higher education qualification(s).” This caused one-year ITE programs to be phased out between 2013 and 2018 and they are no longer available to commence
- 31%, 2017: 8967; 2018: 6180
- -29%, 2017: 9696; 2018: 6891
- -31%, 2017: 7853; 2018: 5398
- 22%; 2017: 26171; 2018: 20295
- Courses delivered both online and on-campus
- Proportion of on-campus commencements 2010: 72%; 2019: 58%; proportion of online commencements: 2010: 19%; 2019: 25%; proportion of multi-modal commencements: 2010: 9%; 2019 16%
- Online: Undergraduate six-year completion rates were 37% (2014); Postgraduate four-year completion rates were 52% (2016)
- Multi-modal: Undergraduate six-year completion rates were 48% (2014); Postgraduate four-year completion rates were 81% (2016)
- Of those entering on the basis of a recorded ATAR, the proportion of ITE students with an ATAR above 70 increased: 2015: 61%; 2019: 72%
- Of those entering on the basis of a recorded ATAR, the proportion of ITE students with an ATAR below 60 decreased: 2015: 16%; 2019: 8%
- ITE enrolments indicate the number of students currently enrolled in ITE programs - this includes students across the pipeline from those who are commencing their first year of study to those who either withdraw from a program or complete a program. National trends in ITE enrolments when used in tandem with commencement, attrition and completion data, begins to provide further insight into the state of the ITE pipeline.
- 2015-2018 change; enrolments: 2% commencements: -15%
- E.g., undergraduate six-year completion rates, 2013 cohort: 51%, undergraduate six-year completion rates, 2005 cohort: 52%
- Proportion of undergraduate students studying part-time: 2015: 20%; 2019: 23%
- The Standards and Procedures for the accreditation of ITE programs introduced in 2011 stipulate the requirement that ITE program structures: “Comprise at least two years of full-time equivalent professional studies in education and be structured so that a graduate has undertaken a four-year or longer full-time equivalent program(s) that leads to a higher education qualification(s).” This caused one-year ITE programs to be phased out between 2013 and 2018 and they are no longer available to commence.
- As a proportion of all admissions: Undergraduate admissions via higher education was 16% of all admissions in 2019; Postgraduate admissions via higher education was 27% of all admissions in 2019
- Original data is available via the ATWD’s Key Metrics Dashboard. Annual growth rates are an average of the annual percentage change between each of the consecutive years.
- Original data is available via the ATWD’s Key Metrics Dashboard. Annual growth rates are an average of the annual percentage change between each of the consecutive years.
- Original data is available via the ATWD’s Key Metrics Dashboard. Annual growth rates are an average of the annual percentage change between each of the consecutive years.
- The proportion of ITE students studying online has increased by 11 percentage points from 2009 (15%) to 2019 (26%).
- A full explanation on how this percentage was calculated is available on the Key Metrics Dashboard on the ‘2019 ITE graduate registrations in 2020’ tile.
- The first step toward working as a teacher is achieving provisional or full registration with a teacher regulatory authority upon completion of an ITE program. The ATWD includes all teachers who are provisionally or fully registered or otherwise authorised to teach in schools and early childhood settings. However, analysis of transitions to registration focuses on the proportion achieving provisional or full registration only.
- 2005: 16,526; 2017: 18,890; 2018; 16,831.
- First year attrition rates: 2005: 10%; 2014: 14%; 2015: 16%; 2018: 18%.
- Postgraduate completions fell -20%; 2017: 7,445; 2019: 5,943, whilst undergraduate completions fell -7%; 2017: 11,445; 2019: 10,701.
- 2010: 27%; 2015: 33%.
- The Standards and Procedures for the accreditation of ITE programs introduced in 2011 stipulate the requirement that ITE program structures: “Comprise at least two years of full-time equivalent professional studies in education and be structured so that a graduate has undertaken a four-year or longer full-time equivalent program(s) that leads to a higher education qualification(s).” This caused one-year ITE programs to be phased out between 2013 and 2018 and they are no longer available to commence.
- The Standards and Procedures for the accreditation of ITE programs introduced in 2011 stipulate the requirement that ITE program structures: “Comprise at least two years of full-time equivalent professional studies in education and be structured so that a graduate has undertaken a four-year or longer full-time equivalent program(s) that leads to a higher education qualification(s).” This caused one-year ITE programs to be phased out between 2013 and 2018 and they are no longer available to commence.
- The proportion of primary students commencing at the postgraduate level rose 14 percentage points (2005: 11%; 2019: 25%). The proportion commencing at an undergraduate level was 89% in 2005, and 75% in 2019.
- The proportion of early childhood students commencing at the postgraduate level rose 15 percentage points (2005: 7%; 2019: 22%). The proportion commencing at an undergraduate level was 95% in 2005, and 78% in 2019.
- ‘Learner levels’ refer to the level of students a teacher is teaching or is qualified to teach in a school or early childhood setting. These include early childhood, primary and secondary levels, with teachers also equipped to teach across multiple learner levels (e.g., early childhood and primary). When referring to ITE qualifications ‘program type’ is used over ‘learner levels taught’; for example an ITE student who completes study in a secondary program type will be equipped to teach at the secondary learner level.
- 2019: 16,644
- ‘Completion rates’ refer to the percentage of students who completed their ITE program as a proportion of the number who commenced the program. Completion rates indicate the conversion of commencements to completions and are impacted by non-completion of a program. The number of conversions can also be impacted by students transferring to a non-ITE program or taking an extended break from study. The completion rate accounts for part-time students taking longer to complete their degrees, students completing their degree in fewer years due to accelerated programs of study or credits from prior studies, and those returning to a course after a 1-year break. Those who return after an extended break are included in the commencing cohort for their year of return. Trends in completion rates are critical for understanding current supply trends and for analysing the future conversion of enrolled students to ITE graduates, determining the commencement levels required in future years to sustain teacher supply.
- Primary postgraduate four-year completion rates decreased (-23 percentage points, 2005: 89% ; 2016 : 66%)
- Primary undergraduate six-year completion rates decreased (-15 percentage points, 2005: 67% ; 2014: 52%)
- 'First-year attrition rates’ refer to the percentage of students as a proportion of commencements, who have not progressed to their second calendar year of study and not completed within one year. The period between program commencement and second year of study is a critical period where some of the highest rates of year-on-year attrition is observed. First year attrition provides an early indication of potential deterioration in program completion rates – i.e., where first year attrition rates are high, eventual program completion rates may be at risk.
- First-year attrition rates refer to 2018 data as students commencing in 2019 have not completed one year at the time of data collection.
- Multi-modal commencements increased on average 5% per year since 2005 compared to on-campus which decreased on average -1% per year and online which increased 9% per year
- Four-year postgraduate completion rate for 2016 cohort.
- Six-year undergraduate completion rate for 2014 cohort.
- Undergraduate completion rates: 31 years or older: -13 percentage points; all other ages: -11 percentage points.
- 2005 postgraduate full-time student completion rate was 92%, postgraduate part-time was 68%; a 23 percentage point gap. In 2019 postgraduate full-time student completion rate was 83%, postgraduate part-time was 41%; a 41 percentage point gap.
- When discussing completion rates, a combination of six-year completion rates for undergraduate programs and four-year completion rates for postgraduate programs are used; this reflects the point by which almost all students have completed their studies or exited the program for undergraduate and postgraduate respectively. In the most recent cohorts, just 3% of students were continuing with their study after these six-year and four-year windows. With current data available up to 2019, six-year completion rates for undergraduate courses can be reported for those commencing up to 2014, while four-year completion rates for postgraduate courses can be reported up to 2016.
- When discussing completion rates, a combination of six-year completion rates for undergraduate programs and four-year completion rates for postgraduate programs are used; this reflects the point by which almost all students have completed their studies or exited the program for undergraduate and postgraduate respectively. In the most recent cohorts, just 3% of students were continuing with their study after these four-year and six-year windows. With current data available up to 2019, six-year completion rates for undergraduate courses can be reported for those commencing up to 2014, while four-year completion rates for postgraduate courses can be reported up to 2016.
- Mixed/other programs are a broad classification indicating that in their course so far an ITE student has undertaken subjects across more than one program-level (early childhood, primary, secondary), or rarely, has completed an accredited ITE degree without completing any but not completed subjects classified as early childhood, primary or secondary. Some individuals in the mix/other category might be early childhood, primary or secondary qualified teachers who have completed a small number of subjects from another ITE program; in future releases, greater information about those in the mix/other category will become available.
- Mixed/other programs are a broad classification indicating that in their course so far an ITE student has undertaken subjects across more than one program-level (early childhood, primary, secondary), or rarely, has completed an accredited ITE degree without completing any but not completed subjects classified as early childhood, primary or secondary. Some individuals in the mix/other category might be early childhood, primary or secondary qualified teachers who have completed a small number of subjects from another ITE program; in future releases, greater information about those in the mix/other category will become available.
- "The proportion of secondary program commencements at an undergraduate level ranged between 54% and 61% between 2005 and 2019 (2005: 61%; 2019: 61%). The proportion commencing at a postgraduate level was 39% in 2005 and 2019.