Executive summary
In 2023, 50,556 registered teachers participated in the Australian Teacher Workforce Survey, the largest survey of teachers in Australia. A little under half (22,509) went on to participate in a new optional wellbeing module. This publication includes analysis of responses to questions from the 2023 Teacher Survey on: work-related stress levels and sources of work-related stress, work-related feelings, burnout, health-related quality of life, job demands and resources, and career intentions.
Job demands and resources
Job resources are the physical, psychological, social and organisational aspects of a job that allow workers to achieve work goals, reduce job demands or encourage personal growth, learning and development (Bakker & Demerouti, 2007). The most prevalent job resources that teachers reported being able to draw on were:
- I know how to go about getting my job done (90%)
- I am clear what is expected of me at work (72%)
- I have some say over the way I get the job done (72%)
- If the work gets difficult, my co-workers will help me (70%)
- I get the help and support I need from my co-workers (68%).
Job resources helped to protect from stress, burnout and negative feelings due to work. They tended to co-occur with happiness and enthusiasm for work.
Job demands are the physical, psychological, social and organisational aspects of a job that require a high level of effort or skills (Bakker & Demerouti, 2007). The most prevalent job demands that teachers reported experiencing were:
- My work is emotionally demanding (86%)
- I get emotionally involved in my work (82%)
- Managing students’ behaviour takes a lot of time and effort (80%)
- I have to neglect some tasks because I have too much to do (71%)
- I have more diverse needs in my class than I, as one teacher, can single-handedly support (67%).
Job demands were more likely to co-occur with stress, burnout, negative feelings and reduced health-related quality of life.
Feelings due to work
Most teachers reported feeling happy or enthusiastic due to their work sometimes (happy: 37%, enthusiastic: 38%), often (happy: 41%, enthusiastic: 32%) or very often / always (happy: 11%, enthusiastic: 11%). Fewer respondents reported rarely (happy: 9%, enthusiastic: 15%) or very rarely / never feeling happy or enthusiastic due to their work (happy: 2%, enthusiastic: 4%).
Most respondents reported feeling worried or miserable sometimes (worried: 33%, miserable: 31%), often (worried: 29%, miserable: 17%) or very often / always (worried: 15%, miserable: 10%). Fewer respondents reported rarely feeling worried or miserable due to their work (worried: 13%, miserable: 22%) or very rarely / never feeling worried or miserable due to their work (worried: 9%, miserable: 20%). High negative feelings due to work (feeling worried or miserable either ‘often’ or ‘very often or always’) were related to higher levels of work-related stress, but experiencing concurrent positive feelings due to work had a protective effect on stress levels.
Stress and stressors
One-quarter (25%) of teachers reported experiencing lower levels of stress, including those who experienced no stress (7%) or low levels of stress (18%). Less than a third reported experiencing moderate levels of stress (29%), while 23% reported experiencing high levels of stress. Fewer teachers reported very high (16%) or severe levels of stress (7%).
The work-related sources of stress teachers reported experiencing most were:
- Workload (58%)
- Dealing with students / parents / community (42%)
- Time pressure (40%)
- Administrative duties (40%)
- Emotional load (32%).
Work-related stress levels and sources of stress varied by teacher groups. For example:
- Teachers over 60 reported ‘technology / equipment’ as a stressor more often than younger age groups
- For casual / relief teachers (CRTs) and those on fixed-term contracts, ‘job security’ was a commonly reported stressor
- Registered teachers working in early childhood settings were less likely to report ‘dealing with students / parents / community’ and ‘workload’ as a source of work-related stress, but more likely to report ‘management of work’ as a stressor compared to teachers working in schools.
Some work-related stressors are infrequently experienced, but when they are, they contribute heavily to teachers’ stress levels. For example, while only 8% of teachers reported experiencing ‘incivility / bullying / harassment’, it was the stressor most associated with higher levels of overall work-related stress.
Teachers’ location
Where teachers work (in metropolitan, inner regional, outer regional or remote / very remote areas) had only a small impact on some measures of their wellbeing, including stress, burnout and feelings due to work. However, teachers in different locations did report markedly different work-related stressors.
Teachers in remote and very remote areas were less likely than those in metropolitan areas to report experiencing the following stressors:
- Administrative duties (35% remote / very remote vs. 47% metropolitan, -12 percentage point difference)
- Time pressure (33% vs. 45%, -12 percentage points)
- Workload (58% vs. 67%, -9 percentage points)
- Dealing with students, parents and the community (38% vs. 46%, -8 percentage points)
- Competing work and home responsibilities (26% vs. 33%, -7 percentage points)
- Work schedule or hours (13% vs. 20%, -7 percentage points).
However, teachers in remote and very remote areas were more likely to experience different stressors, including:
- Social environment (25% remote / very remote vs. 16% metropolitan, +9 percentage points)
- Organisational / workplace change (19% vs. 14%, +5 percentage points)
- Physical aggression, violence (13% vs. 8%, +5 percentage points)
- Unclear job expectations (13% vs. 9%, +4 percentage points)
- Incivility, bullying, harassment (10% vs. 6%, +4 percentage points)
- Work doesn’t match specialisation / experience (11% vs. 7%, +4 percentage points).
Burnout
More than half (56%) of teachers reported experiencing some level of burnout. One-third (34%) reported a low level of burnout (having one or more symptoms of burnout), 12% reported experiencing a medium level of burnout (symptoms won’t go away), and 10% reported high levels of burnout (completely burned out and wondering if they can go on).
Career intentions
There are ample opportunities for retaining teachers in the profession, as most teachers did not report an intention to leave the teaching profession in the short term. Around one-quarter (26%) of teachers reported an intention to stay in the profession until retirement, while just over a third (35%) reported being unsure about their future career intentions.
Almost two-fifths (39%) reported intending to leave the profession before retirement. Of these, most reported either uncertainty in their intended timeframes for leaving the profession (8%) or longer-term timeframes (within 5–9 years, 10%; within 10+ years, 6%). Those who reported an intention to leave in the longer term may not have a firm plan to leave and may not end up leaving the teaching profession at all. There were some teachers who reported shorter-term intentions to leave the profession (within 1 year, 5%; within 2-4 years 9%), whose intentions are more likely to result in real-life attrition.
Burnout and poor health-related quality of life were associated with intentions to leave the teaching profession before retirement. Work-related stress was not strongly related to career intentions.
Fewer teachers who had a combination of low negative and high positive feelings due to work (19%) intended to leave the teaching profession at some point before retirement than the average (39%). However, more teachers with high negative feelings and low positive feelings due to work (66%) intended to leave the profession.
Burnout was particularly associated with intentions to leave teaching in the short term. That is, when reported levels of burnout were higher, there was a greater likelihood of teachers reporting that they intended to leave teaching in the short term compared to the longer term (10+ years).
 Teacher wellbeing is essential, both for teachers themselves and for the students they teach.
Introduction
Teachers are pivotal to the development of Australia’s young people. While it is a highly rewarding and valued profession, teaching is also demanding and has unique challenges. It is crucial that teachers’ wellbeing is safeguarded to ensure the intrinsic rewards of the occupation outweigh its demands. The wellbeing of teachers has been a national topic of conversation in recent years, intensified by the pressures of the COVID-19 pandemic and rapid transitions to remote learning (AITSL, 2022; Billett et al., 2023; Collie, 2023; Dabrowski, 2020). Australia is also facing a critical shortage of teachers, making teacher retention more important than ever (Australian Government Department of Education, 2022). Recognising the importance of teachers’ professional wellbeing, the Australian Government, state and territory governments and the independent and Catholic school sectors have developed a range of policies and programs that aim to support teachers through the National Teacher Workforce Action Plan and state and territory and non-government wellbeing plans, strategies and frameworks. These are described in more detail in Table 1.
In 2023, one-quarter (26%) of teachers reported an intention to stay in the teaching profession until retirement, while a further one-third (35%) were unsure about their intentions and two-fifths (39%) intended to leave at some point before retirement. While reported intentions to leave do not necessarily translate to actual attrition from the workforce,[1] this finding indicates that the workforce is experiencing some strain, particularly when coupled with the reality of teacher shortages in Australia (Australian Government Department of Education, 2022). However, these statistics compare favourably to those regarding teachers in the USA, where 17% reported that they were somewhat or very likely to leave their profession in the next year (Doan et al., 2024) and in the UK, where in 2023, 16% of teachers intended to leave teaching in the next 2 years (National Education Union, 2023). Meanwhile, in Australia, only 5% of teachers planned to leave within one year, with an additional 9% planning to leave in 2-4 years. Teachers who were considering leaving their profession in the UK reported doing so because the high workloads and low pay were impacting negatively on their mental health (National Education Union, 2023). To avoid similarly high rates of attrition in Australia, it is imperative that a better understanding of the link between teachers’ professional wellbeing and their career intentions is developed.
Teacher retention is vital, as is safeguarding teacher wellbeing. All governments and sectors are working towards these ends (Table 1). At the national level, this includes the National Teacher Workforce Action Plan (Action Plan), which aims to address the issue of teacher workforce shortages. Under Priority Area 5, this includes an action to develop and publish data on teacher wellbeing and career intentions (Action 27), as agreed by all education ministers (Department of Education, 2022). To implement this action, AITSL developed new wellbeing questions for the 2023 Australian Teacher Workforce Survey (Teacher Survey).[2] One of the key goals of Action 27 is to understand how wellbeing impacts workforce retention. As such, this edition of In Focus examines the relationship between professional wellbeing and career intentions to offer useful insights into opportunities for protecting teacher wellbeing and boosting teacher retention.
Table 1: Examples of teacher wellbeing policies, programs, initiatives and strategies, by jurisdiction / sector
National
Australian Government Department of Education | National Teacher Workforce Action Plan (NTWAP) The Australian Government, in collaboration with the states and territories and the non-government sector, is supporting teacher wellbeing through addressing teacher shortages, reducing workloads and raising the status of the profession. |
Australian Government Department of Education | Workload Reduction Fund The Australian Government is working with states and territories to pilot new approaches to reduce teacher and school leader workloads and maximise the value of teachers’ and school leaders’ time. |
Australian Government Department of Education | Be You The Australian Government, through the Department of Health, provides Be You, a national mental health initiative to support educators from early learning services and schools to develop positive, inclusive and resilient learning communities where every child, young person, educator and family can achieve their best possible mental health. |
Australian Government Department of Education | National Principal Reference Group In June 2024, the Federal Minister for Education agreed to establish a National Principal Reference Group consisting of all nine national principal associations. The Reference Group is a forum to discuss topics of importance to the profession, such as principal and school leader wellbeing and efficacy. |
Australian Government Department of Education | Be That Teacher campaign The Be That Teacher campaign ran from October 2023 to June 2024 and showcased the value and importance of teachers and encouraged people to consider a career in teaching. The campaign was an important start to shifting attitudes and perceptions about the teaching profession. |
AITSL | Induction and Mentoring of Early Career Teachers In support of teacher retention, under Action 14 of the Action Plan, AITSL developed Guidelines for the Induction of Early Career Teachers in Australia and Guidelines for the Induction of New School Leaders in Australia endorsed in December 2023 by Education Ministers. AITSL is currently developing guidelines on mentoring of early career teachers. |
Australian Government Department of Education | Indigenous Cultural Responsiveness Initiative The initiative aims to support the cultural responsiveness of teachers and leaders to enhance their teaching practice. The initiative will contribute to cultural safety in schools, reduce cultural load on First Nations teachers and improve the wellbeing of First Nations teachers in the workplace. |
State/Territory
Australian Capital Territory | Safety and Wellbeing Strategy 2024–2026 The Education Directorate has launched the Safety and Wellbeing Strategy to highlight safety and wellbeing priorities and initiatives to support an improvement journey. The strategy supports a measurement and evaluation framework and an uplift in the safety and wellbeing culture of the organisation. 2024 Safety and Wellbeing Action Plan The Action Plan identifies key initiatives that will be delivered under the strategy, including a Psychosocial Safety and Wellbeing Framework and a supporting wellbeing plan at a directorate / school / branch and individual level. Safety and Wellbeing Policy The Safety and Wellbeing Policy supports inclusive workplaces that manage risks to physical and psychological health and safety. Services and supports for teachers are also accessible on the directorate’s intranet. |
New South Wales | Staff Wellbeing Strategy 2024–27 The Staff Wellbeing Strategy outlines the Department of Education's vision and priorities for a public education system where all staff are supported to perform at their best and feel trusted and valued. The strategy outlines how the department will improve staff wellbeing across the three key priorities of: supporting our staff, leading our people and streamlining our work. Alongside the strategy a Staff Wellbeing Team was established to facilitate meaningful engagement with teachers and principals statewide and to deliver practical solutions that strengthen systems and processes that support staff wellbeing. |
Northern Territory | School Leader Wellbeing Action Plan 2021–2025 Principal Wellbeing Framework (2019) Teacher Wellbeing Strategy 2019–2022 The Department of Education and Training has a range of plans, frameworks and strategies, along with accompanying resources, aimed at building ‘a culture of wellbeing and support for all employees’, including school leaders and teachers. |
Queensland | Health, Safety and Wellbeing Policy The policy outlines the department’s obligations and principles relating to the health, safety and wellbeing of all workers of the department. Creating Healthier Workplaces As part of the department's commitment to supporting staff health and wellbeing, information is available to help staff manage their wellbeing and implement a staff health and wellbeing program at their workplace. There are a number of tools, resources and information sources provided. |
South Australia | myWellbeing survey Teacher wellbeing is measured through a survey designed to understand how to best support wellbeing at a local level. Support and resources are provided to allow each site to understand their results, and respond to the insights to better support staff wellbeing. Under the South Australian School and Preschool Education Staff Enterprise Agreement 2024 there are a range of initiatives that support teacher wellbeing through workload reduction measures, including a focus on mentoring, complexity funding and how support staff can assist teachers to manage their workload. Enterprise Agreement Tailored and responsive professional clinical support is available for teachers at high-risk sites and following critical incidents. Employee psychological support Counselling support is available to all staff. |
Tasmania | Staff Wellbeing Action Plans (various in place since 2022) The Department for Education, Children and Young People has had action plans in place targeting staff wellbeing since 2022. Teacher wellbeing is monitored via the annual Staff Wellbeing Survey and from 2023 deeper analysis of factors driving wellbeing outcomes has been undertaken. These results are reported across the school system so they can be shared in collaborative inquiry processes, along with tools and resources to support school-level actions. There are also staff wellbeing webinars and information on a Sharepoint Hub, along with an Employee Assistance Program. Induction programs for early career teachers include a staff wellbeing component. Principal Wellbeing Action Plan The Principal Wellbeing Action Plan sets out a wide range of actions related to sustainability, workload and staffing, principal preparation and development, support systems, managing challenging behaviours, and holistic approaches to wellbeing. There is also an Accountabilities Toolkit for principals that includes information and resources about staff wellbeing. |
Victoria | Safe and Well in Education Strategy 2019–2024 The Safe and Well in Education Strategy provides a clear roadmap for the Department of Education to systematically enhance and support health, safety and wellbeing in the workplace. A key priority of the strategy is building a strong focus on mental health and wellbeing. Safe and Well in Education Framework The Safe and Well in Education Framework works in conjunction with the strategy and assists staff to understand their health, safety and wellbeing accountabilities and responsibilities, and the supports available to acquit these obligations. Principal Health and Wellbeing Supports The Principal Health and Wellbeing supports commenced in 2018 as part of the Principal Health and Wellbeing Strategy 2018–2021 and are now ongoing services. These supports include: the School Policy Templates portal; Principal Mentoring; Proactive Wellbeing Support; Principal Health Checks; Complex Matter Support Team; and the Early Intervention Program. 2024–25 Victorian State Budget investment of $63.8 million over 4 years in improving school staff mental health and wellbeing. The 2024–25 Victorian State Budget provides $63.8 million over 4 years to improve the mental health and wellbeing of government school employees, spanning across promotion, prevention and response. This includes: proactive promotion of mental health and wellbeing in schools; preventative peer supervision support; resources for management and prevention of psychosocial hazards in schools; early response and intervention for school staff at greatest risk of mental injury; and improved return-to-work support for complex workers’ compensation claims. |
Western Australia | Staff Health and Wellbeing Strategy 2023–2027 This strategy lays out the Department of Education’s health and wellbeing priorities and initiatives, and includes how they will measure the impact of their strategy. These initiatives include: creating a culture of wellbeing; embedding wellbeing into policies and processes, and enhancing physical environments to support wellbeing. |
Independent sector (examples)
The Association of Independent Schools of the ACT | Guiding Principles for Teacher and School Staff Wellbeing The Guiding Principles are designed for implementation at the school level. They are for school leaders and those involved in teacher and school staff wellbeing to explore and assess their own journey and next steps around teacher and school staff wellbeing, with the goal of identifying opportunities for improvement within the scope of influence of the school itself. |
The Association of Independent Schools of NSW | Whole School Wellbeing Whole School Wellbeing is a multi-component initiative focused on strengthening a whole-school approach to wellbeing. |
Catholic sector (examples)
Catholic Education Western Australia | Strategic Wellbeing Framework The Strategic Wellbeing Framework sets out the ways in which new wellbeing changes can be created, implemented, evaluated and refined. |
What is professional wellbeing?
Professional wellbeing broadly refers to “how workers are doing” and is impacted by all aspects of work life (Litchfield, 2021). It not only encompasses physical wellbeing but also psychological and social wellbeing, as well as the ways in which work impacts life in general (Litchfield, 2021). This includes workload, support (from both leadership and colleagues), and engagement with work and feelings about the nature of one’s work. In this publication, professional wellbeing specifically refers only to wellbeing due to work.
Supporting teachers’ wellbeing ensures they can focus on what matters most – helping young people learn and thrive. Positive professional wellbeing is linked to teachers feeling more engaged with their job, having greater belief in their teaching abilities, spending more one-on-one time with their students, and making their lessons deeper and more enjoyable for their students (Turner & Theilking, 2021; Viac & Fraser, 2020). When teachers’ professional wellbeing is good, students feel more confident and motivated, are calmer in class, are more engaged with learning and complete more work (Turner & Theilking, 2021; Viac & Fraser, 2020). In addition to teachers feeling happier and more engaged at work, high wellbeing is also associated with teachers being more likely to stay in the workforce (Collie, 2023; Thorpe et al., 2020; Wang & Hall, 2021).
When teachers’ professional wellbeing is low, however, it is linked to worse outcomes for both students and teachers (Viac & Fraser, 2020). Low professional wellbeing can include experiences of burnout. Burnout is a reaction to prolonged exposure to workplace stressors, developing gradually when work is unfulfilling, unrewarding and unpleasant (Iancu et al., 2018; Saloviita & Pakarinen, 2021). It is comprised of three factors: emotional exhaustion (a lack of resources for handling emotional situations), feelings of detachment and cynicism towards one’s job, and professional inefficacy or lack of accomplishment (Iancu et al., 2018; Saloviita & Pakarinen, 2021). Burnout in teachers has been linked to poor physical and mental health, reduced student achievement and adjustment, poor job performance and greater intentions to leave the profession (Madigan & Kim, 2021; Saloviita & Pakarinen, 2021).
This demonstrates how aspects of professional wellbeing are related to retention and are therefore essential for the healthy functioning of the teacher workforce and the school system across Australia.
Wellbeing in the Australian Teacher Workforce Survey
Every registered teacher in Australia is invited to participate in the Teacher Survey, which is distributed each year by teacher regulatory authorities on behalf of the ATWD. The Teacher Survey provides a voice for Australian teachers on their experiences in the profession as well as their career intentions. Since all registered teachers have the opportunity to participate, the Teacher Survey provides the most comprehensive data available on the experiences of the teacher workforce.
In 2023, questions about wellbeing were added to the Teacher Survey for the first time. There were 50,556 responses to the Teacher Survey, with 41,493 completing at least one of the new questions on professional wellbeing in the main section of the Teacher Survey, and 22,509 of those respondents also opted into the additional module containing further wellbeing questions. This resulted in the most comprehensive study of Australian teacher wellbeing to date.
An eleven-member Expert Advisory Group (the Advisory Group) was established to develop the wellbeing measures for the Teacher Survey. Membership was intended to achieve broad and balanced coverage across the education sector and academic expert community, with representation from different states and territories, as well as wellbeing experts and representatives from diverse professional backgrounds. In developing the measures, the Advisory Group determined it was important to use previously validated and established measures where possible, thereby ensuring a robust measurement approach and enabling trends over time to be monitored.
The four professional wellbeing questions integrated into the main Teacher Survey corresponded to questions used in the annual People Matter survey in Victoria (2023).[3] The wellbeing questions in the main section of the Teacher Survey explored:
- Work-related stress
- Causes of work-related stress[4]
- How work made teachers feel (miserable, worried, happy, or enthusiastic)
- Work-related burnout.
In addition to the wellbeing questions included in the main Teacher Survey, an optional wellbeing module was included to obtain a broader range of data. Analysis of these questions considered the likelihood[5] that those who opted to participate may have been experiencing lower levels of wellbeing than those who chose not to complete the module. The questions focused on:
- Health-related quality of life
- Teaching demands and resources
- Personal safety:
- How safe and unsafe teachers felt at work overall, physically, psychologically, and culturally
- Things that promoted or challenged safety
- Follow-up sections to deepen understanding of specific stressors:[6]
- Incivility, bullying and harassment
- Physical aggression and violence
- Racism and discrimination.
All wellbeing questions in the Teacher Survey were related to ‘work’ or the ‘teaching profession’ – except for the health-related quality of life measures, which was more general in nature. A full list of the Teacher Survey items used in the analysis reported in this publication is included in the Technical Appendix.
Defining the measures
Job demands-resources
Respondents were asked to rate to what extent they agreed or disagreed (from ‘strongly disagree’ to ‘strongly agree’) with a list of 7 job demand concepts and 9 job resource concepts across 32 survey items (see Table 6 and the Technical Appendix). Each demand and resource concept was asked about twice. For example, the concept of ‘being emotionally involved in one’s work’ was explored via the two items: ‘my work is emotionally demanding’ and ‘I get emotionally involved in my work’, which were presented in a random order. These paired concepts reflected different domains of job demands-resources. Having multiple measures of each domain of job demands-resources ensured more robust properties of the scale, just like using a scale to measure a concept is more robust than only using a single item. Other measures in the literature often used even more items per domain, but we chose two as a compromise between survey length, number of domains, and robust measurement.
The job demand and resources items were developed by establishing a pool of questions drawn from existing surveys of job demands and resources for teachers (e.g., the work of Rebecca Collie and colleagues (Collie, 2023)). Drawing on the expertise of the Advisory Group, the wording of existing items was then adjusted to suit a national Australian teaching context across all positions and settings. These questions were supplemented with some additional items to cover gaps that were identified by the Advisory Group.
Positive and negative feelings due to work
‘Feelings’ in this context refers to the emotions that people feel and display. Positive feelings include emotions like joy and happiness, while negative feelings include emotions like sadness and anxiety. To measure positive and negative feelings, the Teacher Survey included a question that asked teachers how work in their current organisation had made them feel over the last three months. Teachers rated how often (on a scale from ‘never or very rarely’ to ‘very often or always’) over the past 3 months their work had made them feel:
- Worried
- Miserable
- Happy
- Enthusiastic.
There are two conceptual views of feelings, a unidimensional view from positive to negative, and a multidimensional view with low positive feelings to high positive feelings as one dimension and low negative feelings to high negative feelings as a second dimension. Analysis indicated that in the Teacher Survey, data fit the multidimensional view.[7] As such, positive feelings and negative feelings were treated as two distinct measures.
Work-related stress
Work-related stress was measured by asking respondents how they would rate their current level of work-related stress on a 6-point Likert scale from ‘nil – not experiencing any work-related stress’ to ‘severe’.
Work-related stressors
Respondents were also asked about specific workplace stressors if they had reported at least ‘low or mild’ work-related stress.[8] They were able to select up to 5 stressors from a randomised list of 22 options in response to the question, ‘What are the main causes of your work-related stress?’. An additional option was ‘Other (please specify)’, which was not included in the analyses in this publication.
Work-related burnout
To measure work-related burnout, respondents were asked to rate their level of burnout on a quasi-continuous Likert-like scale (as used in the People Matter survey) from ‘no symptoms of burnout’ to ‘complete burnout’ as follows:
- I enjoy my work. I have no symptoms of burnout
- Occasionally I am under stress, and I don’t always have as much energy as I once did, but I don’t feel burned out
- I am definitely burning out and have one or more symptoms of burnout, such as physical and emotional exhaustion
- The symptoms of burnout that I am experiencing won’t go away. I think about frustration at work a lot
- I feel completely burned out and often wonder if I can go on. I am at the point where I may need some changes or may need to seek some sort of help.
Health-related quality of life
Health-related quality of life is the extent to which an individual’s feelings about their life and wellbeing are impacted by physical and emotional problems. This can be measured through the Short Form 36 (SF-36; (Ware & Sherbourne, 1992), a scale that asks people about their experiences over the last four weeks. The SF-36 is a domain-agnostic measure; that is, a person answers the questions about all their experiences, both inside and outside of the workplace.
This measure of health-related quality of life was chosen to align with the Household, Income and Labour Dynamics in Australia (HILDA) Survey. HILDA is the longest-running national household panel survey in Australia and continues to be conducted annually. It asks questions about many aspects of Australian life, including wellbeing. Alignment of the health-related quality of life measure with the HILDA Survey means that, in the future, longitudinal trends in teachers’ health-related quality of life can be understood in the context of broader societal changes.
The SF-36 has two broad component scores, a physical health component score and a mental health component score. In the wellbeing module of the Teacher Survey, only the questions related to the mental health component of health-related quality of life were included. Health-related quality of life was measured using questions about four different factors of the mental health component: mental health, vitality, social functioning and emotional functioning. For two of these factors, teachers were asked how often they had felt certain feelings in the past 4 weeks, on a scale from ‘none of the time’ to ‘all of the time’. These included:
- Mental health, e.g., ‘have you felt downhearted and blue?’
- Vitality, e.g., ‘did you have a lot of energy?’
Emotional functioning was measured by asking teachers whether experiencing emotional problems such as feeling anxious or depressed had had a negative effect on their work or daily activities, such as:
- Cutting down the amount of time they spent on work or other activities
- Accomplishing less than they would like to
- Not doing work or other activities as carefully as usual.
Social functioning was measured by asking respondents whether physical health or emotional problems had interfered with their normal social activities on a scale from ‘not at all’ to ‘extremely’.
Career intentions
Respondents were asked whether they intended to leave the profession before retirement (‘yes’, ‘no’, ‘unsure’). Where respondents indicated that they intended to leave before retirement, they were asked a follow-up question regarding how many years they intended to stay in the profession.
A total of 50,556 teachers across Australia participated in the main part of the Teacher Survey, with 41,493 answering at least one of the wellbeing questions in the main survey and 22,509 completing at least one question in the optional wellbeing module. This was a representative survey, meaning that the results from the survey can be assumed to apply to all teachers across Australia, not just the ones who took the survey.[9] The survey is representative because it uses weighted data, which corrects for the over- or under-representation of survey responses from different states and territories and the known demographics (age and gender) within the states and territories, as well as the variation in wellbeing responses.
As shown in Table 2, of the teachers who completed the main survey, most were female (77.2%), aged between 30 and 49 years old (48.8%) and lived in metropolitan areas (70.9%).[10] The largest number of respondents were from New South Wales (31.5%) and Victoria (25.1%). Most teachers were born in Australia (81.7%).
Most respondents to the main section of the Teacher Survey worked as classroom teachers (66.3%), were employed in schools (59.6%), were employed under ongoing contracts (82.5%) and had worked in the teaching profession for between 10 and 19 years (28.0%). For the respondents who went on to complete the optional module with additional wellbeing questions, these characteristics were proportionally similar.
Table 2: Teacher Survey respondent characteristics
Job demands-resources
Job demands are the physical, psychological, social and organisational aspects of a job that require a high level of effort or skills, meaning that they are associated with physical or psychological costs to the worker (Bakker & Demerouti, 2007). They can include a high workload, conflicts with colleagues and an unfavourable physical environment. Job demands are not necessarily negative; some, like a high workload, can be seen as a challenge rather than a stressor. Job demands can become job stressors, though, if the employee is not able to fully recover from the effort required to meet those demands.
Job resources, on the other hand, are the physical, psychological, social and organisational aspects of a job that allow workers to achieve work goals, reduce job demands or encourage personal growth, learning and development (Bakker & Demerouti, 2007). They can include things like supervisor support, being able to learn and employ a variety of different job skills, and getting useful feedback on performance.
Research has demonstrated that both job demands and job resources impact teachers’ wellbeing, which in turn influences their desire to leave their current job (Collie, 2023) or the profession (Skaalvik & Skaalvik, 2018).
In addition to reporting on the results of the Teacher Survey, the well-established job demands-resources model (Bakker & Demerouti, 2017; Lesener et al., 2019) was used to understand the relationship between teachers’ experiences at work and their professional wellbeing.
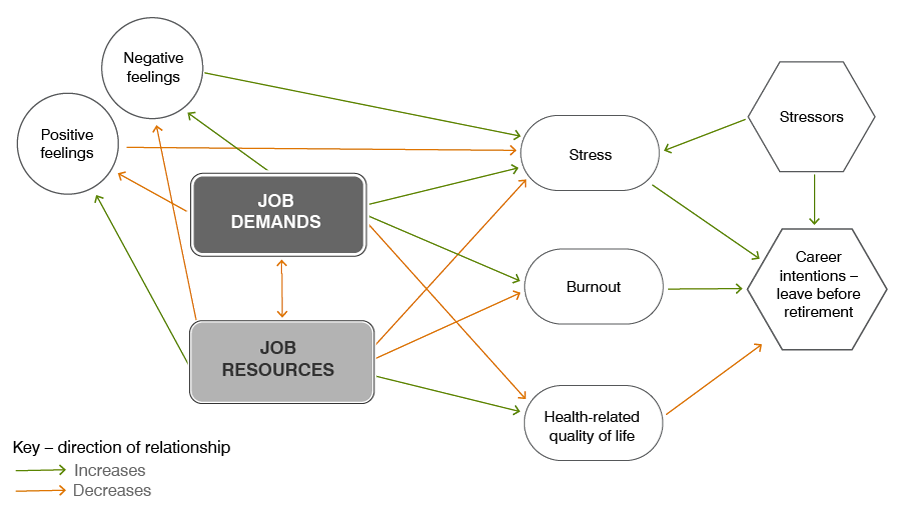
In this publication, the model used conceptualises job demands and resources as having an impact on professional wellbeing, including burnout, stress, health-related quality of life and feelings due to work (Figure 1). These, in turn, affect teachers’ career intentions.
Figure 1: The job demands-resources model
Which job resources did teachers experience?
The job resources that teachers reported being able to draw on most (strongly agree or agree) were:
- I know how to go about getting my job done (90%)
- I am clear what is expected of me at work (72%)
- I have some say over the way I get the job done (72%)
- If the work gets difficult, my co-workers will help me (70%)
- I get the help and support I need from my co-workers (68%).
A small proportion of teachers (3-12%) reported not having access to each of these five job resources (strongly disagree or disagree), with the remaining teachers impartial (neither agree nor disagree).
Which job demands were affecting teachers the most?
The job demands that teachers reported experiencing most (strongly agree or agree) were:
- My work is emotionally demanding (86%)
- I get emotionally involved in my work (82%)
- Managing students’ behaviour takes a lot of time and effort (80%)
- I have to neglect some tasks because I have too much to do (71%)
- I have more diverse needs in my class than I, as one teacher, can single-handedly support (67%).
A small proportion of teachers (5-15%) reported not experiencing each of these five job demands (strongly disagree or disagree), with the remaining teachers impartial (neither agree nor disagree).
How job demands and resources affect professional wellbeing
Analysis of data from the Teacher Survey supports the model in Figure 1 (for more information, see the Technical Appendix). Having greater access to job resources was associated with lower reported levels of stress, burnout and negative feelings due to work. Job resources were also related to higher reported levels of health-related quality of life and positive feelings due to work. Positive and negative feelings had the strongest relationship to job resources. In contrast, experiencing more job demands was related to having greater reported levels of burnout, negative feelings and stress, along with lower reported levels of health-related quality of life.
Positive and negative feelings towards work
People often experience a range of emotions due to their work. Every job involves enjoyable activities, some measure of stress or boredom and often, feelings of satisfaction and accomplishment. These feelings can vary over time and in response to the type of work that an employee is asked to complete. The measure included in this section of the Teacher Survey asked teachers: “Thinking about the past 3 months in your current organisation, how often has your work made you feel happy / enthusiastic / worried / miserable?”.
A high proportion of teachers reported feeling happy (89%) and enthusiastic (81%) due to their work. Respondents reported feeling happy and feeling enthusiastic sometimes (happy: 37%, enthusiastic: 38%), often (happy: 41%, enthusiastic: 32%) or very often or always (happy: 11%, enthusiastic: 11%; Figure 2). Fewer respondents reported rarely feeling happy or enthusiastic due to their work (9%, 15%) or never or very rarely feeling happy or enthusiastic due to their work (happy: 2%, enthusiastic: 4%).
Figure 2: Proportion of teachers reporting how often their work made them feel positive (happy, enthusiastic)
While levels were generally lower than reported levels of feeling happy and enthusiastic, teachers also reported feeling worried (77%) and feeling miserable (58%) due to their work. Respondents reported feeling worried or feeling miserable sometimes (worried: 33%, miserable: 31%), often (worried: 29%, miserable: 17%) or very often or always (worried: 15%, miserable: 10%; Figure 3). Fewer respondents reported rarely feeling worried or miserable due to their work (13%, 22%) or never or very rarely feeling worried or miserable due to their work (worried: 9%, miserable: 20%). Notably, more teachers reported that they felt worried due to work than miserable. This is not necessarily cause for concern, as there is a healthy amount of worry that one can feel due to work. Teachers must navigate challenging situations with students and parents. Some amount of worry about their students may indicate that they are taking these situations seriously and care about the students they teach.
Figure 3: Proportion of teachers reporting how often their work made them feel negative (worried, miserable)[11]
How feelings due to work affect stress
Negative feelings had a clear relationship to reported stress levels. On a 6-point scale from 0 (nil) to 5 (severe), teachers with high negative feelings due to work reported the highest levels of work-related stress (3.12–3.63), while those with medium levels of negative feelings reported medium levels of stress (2.33–2.39) and those with low negative feelings reported the lowest levels of stress (1.42–1.77; Figure 4).
For teachers reporting high negative feelings, positive feelings had a somewhat protective effect on stress levels. Teachers with high negative feelings reported the highest level of work-related stress when they also had low positive feelings (3.63), a lower level of stress when they had medium positive feelings (3.31), and an even lower level of stress when they had high positive feelings (3.12).
Figure 4: Mean level of stress reported by survey respondents in each feelings category
How job demands and resources drive positive and negative feelings
Statistical modelling examined the relationship between job demands-resources and positive feelings due to work (happy, enthusiastic), as well as job demands-resources and negative feelings due to work (worried, miserable).[12]
The strongest drivers of positive feelings due to work were:
- Student behaviour: ease of behavioural management
- Time pressure: realistic time to undertake tasks
- Autonomy: choice in decision-making
- Co-worker support: supportive co-workers when help is needed
- Manager support: supervisors who value contributions and give credit.
The strongest drivers of negative feelings due to work were:
- Emotional involvement in work: finding work emotionally demanding
- Time pressure: unrealistic time to undertake tasks
- Student behaviour: difficulty with behavioural management
- Autonomy: lack of choice in decision-making
- Incompatible demands: conflicting work demands.
Drivers of positive feelings due to work
Student behaviour
When teachers felt they were able to easily manage their classrooms and their students were engaged in their work, they tended to have more positive feelings. Positive feelings were higher, and negative feelings were lower, where respondents did not agree with the statements:
- Managing students’ behaviour takes a lot of time and effort
- Many of my students show little effort at schoolwork.
The two items were moderately positively correlated (r=.341). A correlation between two items in this context means that the items are related to each other. The stronger the correlation, the more related they are to each other.
Time pressure
When respondents felt they had plenty of time to complete their tasks, positive feelings were generally higher. Positive feelings were higher, and negative feelings were lower, where respondents did not agree with the statements:
- I have unrealistic time pressures
- I have to neglect some tasks because I have too much to do.
The two items were moderately positively correlated (r=.479).
Autonomy
When respondents felt they had control over what they did at work, positive feelings were higher. Positive feelings were higher, and negative feelings were lower, where respondents agreed with the statements:
- I have a choice in deciding what I do at work
- I have some say over the way I get the job done.
The two items were moderately positively correlated (r=.532).
Co-worker support
When respondents were in a positive work environment and felt they could rely on their co-workers to help both practically and emotionally when needed, positive feelings were higher. Positive feelings were higher if respondents agreed with the statements:
- If the work gets difficult, my co-workers will help me
- I get the help and support I need from my co-workers.
The two items were moderately positively correlated (r=.650).
Manager support
Feeling supported by management, and feeling valued at work, made respondents feel happier and more enthusiastic. Positive feelings were higher where respondents agreed with the statements:
- I feel that my supervisor values my contributions to this school / early learning centre / pre-school
- My supervisor gives me sufficient credit for my hard work.
The two items were strongly positively correlated (r=.734).
Drivers of negative feelings due to work
Emotional involvement in work
When respondents were very emotionally involved in their work, they were more likely to feel worried or miserable. Negative feelings were higher where respondents agreed with the statements:
- My work is emotionally demanding
- I get emotionally involved in my work.
The two items were weakly positively correlated (r=.294).
Incompatible demands
When respondents felt they were being pulled in two directions at once and did not have the time to complete what was being asked of them, they were more likely to feel worried or miserable at work. Negative feelings were higher where respondents agreed with the statements:
- Different teams at work demand things from me that are difficult to do at the same time
- I receive incompatible requests from two or more people.
The two items were moderately positively correlated (r=.508).
Work-related stress
Experiencing some stress at work is not only normal but can be motivating, lead to higher output and, ultimately, be satisfying (Teasdale, 2006). However, there is a point beyond which stress becomes negative, causing reduced efficiency, performance and job satisfaction (Teasdale, 2006).
One-quarter (25%) of teachers reported experiencing lower levels of stress, including those who experienced no stress (7%) and those who experienced low levels of stress (18%; Figure 5). The most common level of stress teachers reported was moderate levels (29%), less than one-quarter reported high levels of stress (23%), and fewer teachers experienced very high levels of stress (16%) or severe levels of stress (7%).
Figure 5: Proportion of teachers reporting different levels of stress
Stress levels varied across different respondent characteristics. Older teachers were less likely to report experiencing very high or severe levels of stress than younger teachers. Reported stress levels also varied by position in school. Casual / relief teachers (CRTs) of all ages and classroom teachers aged over 60 were less likely to report very high or severe stress levels than leaders and younger teachers (Figure 6).
Figure 6: Proportion of teachers reporting very high or severe stress, by position in school and age
Sources of work-related stress
The work-related stressors teachers reported experiencing the most were:
- Workload (58%)
- Dealing with students / parents / community (42%)
- Time pressure (40%)
- Administrative duties (40%)
- Emotional load (32%).
These stressors reflect commonly-cited issues among the teacher workforce in Australia. For example, workload and time pressures have been recognised as a common source of concern among Australian teachers (Heffernan et al., 2019), while high levels of administrative work have also been identified as a notable source of teachers’ stress (Carroll et al., 2022).
The stressors that teachers were the least likely to report experiencing were:
- Incivility, bullying, harassment (8%)
- Content, variety or difficulty of work (6%)
- Physical environment (5%)
- Racism, discrimination (2%)
- Additional work is given to me because of my identity (e.g., race, gender, sexuality, etc.; 1%).
How stressors drive stress levels
Although the top 5 work-related stressors were most frequently reported by teachers, they were not necessarily associated with the greatest differences in stress levels. A multiple regression analysis indicated that some stressors increased teachers’ stress levels to a larger degree than others (Figure 7).
Across all respondents, the stressors with the strongest relationship to overall stress were:
- Incivility, bullying and harassment
- Workload
- Physical aggression / violence
- Emotional load
- Social environment.
Figure 7: Strength of relationships between stressors and stress level
Note. The regression coefficient (β) indicates the strength of the association between the stressor and stress level. These values show the relative impact of each stressor on stress levels. The error bars in Figure 7 denote the 95% confidence interval (CI) for each coefficient. Larger error bars (i.e., a wider confidence interval) occur when a stressor has a smaller sample size – that is, experienced by a smaller number of respondents (Hazra, 2017).
Stressors by group
As overall stress levels vary across different groups of teachers, and since each stressor has a different relationship to overall levels of work-related stress, it is useful to analyse how stressors may vary across groups.
Understanding heatmaps
This section uses heatmaps to show how specific stressors vary across different teacher groups.
The heatmaps in this section show the proportion of each group of teachers who nominated each stressor as a cause of stress. The heatmaps feature a colour gradient from light yellow to dark blue – the higher the proportion of that group (row) who reported each stressor (column), the darker the square in the heatmap will appear. In general, dark blue squares correspond to stressors selected by a very large proportion of the group. The lighter the square, the lower the proportion of teachers who reported that stressor.
Age
Younger teachers reported higher proportions of both ‘workload’ and ‘emotional load’ as causes of stress relative to older teachers. Teachers aged under 29 were also more likely to report ‘job security’ and ‘required / expected to work from school’ as stressors (Figure 8).
The proportion of teachers citing ‘competing work / home responsibilities’ as a stressor increased for those aged 30–39 and peaked among those aged 40–49. This may reflect a greater proportion of teachers transitioning into middle and senior leadership roles, as highlighted in National Trends: Teacher Workforce. This could also reflect teachers in these age groups being more likely to have younger children at home, resulting in a greater level of home responsibilities that compete with work.
‘Technology / equipment’ and ‘organisational / workplace change’ were cited more often as stressors by older teachers, which may reflect ongoing technological and organisational advancements in the classroom.
Teachers aged 69 and over were less likely to report stressors overall. However, these teachers also reported slightly higher proportions of ‘incivility, bullying and harassment’ and ‘work doesn’t match specialisation / experience’ relative to other age groups.
Figure 8: Work-related stressors, by age group
Position in school
There were large variations in work-related stressors across teacher positions (Figure 9). Across leadership roles, senior leaders reported higher proportions of ‘dealing with students / parents / community’ and ‘emotional load’ as stressors compared to other positions. This may reflect a higher degree of stressful interactions with students, parents and the wider community that is experienced in senior leadership roles (Mahfouz, 2020).
Middle leaders were moderately more likely to report ‘administrative duties’ as a cause of stress relative to classroom teachers, which may be due to middle leaders facing a greater degree of administrative duties and time pressure in their role (Lipscombe et al., 2023).
‘Physical aggression and violence’ and ‘incivility, bullying and harassment’ were not commonly experienced across respondents. However, teachers on leave, senior leaders and CRTs aged 40–59 were more likely to report ‘physical aggression and violence’ as a stressor. Similarly, more teachers on leave and CRTs aged over 60 reported ‘incivility, bullying and harassment’ as a stressor.
In general, CRTs reported stressors in lower proportions than those in other positions. However, among CRTs aged under 60, ‘job security’ was more likely to be reported as a stressor relative to other groups. Additionally, CRTs were more likely to report higher proportions of ‘work doesn’t match specialisation’ and ‘technology / equipment’ as causes of stress. CRTs may be more likely to report ‘work doesn’t match specialisation’ due to the nature of casual contracts, where teachers may have a limited ability to choose subject preferences (Shah et al., 2020).
Registered teachers working in early childhood settings were less likely to report ‘dealing with students / parents / community’ than other teacher groups. They were more likely to report ‘management of work’ and somewhat less likely to report ‘workload’ as sources of stress compared to teachers working in schools.
Figure 9: Work-related stressors, by position in school
Contractual arrangement
Across contractual arrangement types, a much higher proportion of teachers on fixed-term contracts selected ‘job security’ as a stressor compared to those on ongoing contracts (Figure 10). This pattern was even more noticeable for those on shorter-term contracts (1 year or less).
Workload was frequently reported as a stressor for all groups irrespective of contractual arrangement, though it was more heavily reported for those in ongoing employment than those on fixed-term contracts. Similarly, teachers employed on an ongoing basis were somewhat more likely to report ‘time pressure’ and ‘administrative duties’ relative to teachers on fixed-term contracts.
Figure 10: Work-related stressors, by contractual arrangement type
Overall work-related stress level
There were notable differences in causes of stress by overall stress levels (Figure 11). Those who reported experiencing severe stress were more likely to select ‘social environment’, ‘physical aggression, violence’ and ‘incivility, bullying, harassment’ than respondents reporting lower levels of stress. For those experiencing severe stress, ‘competing work / home responsibilities’ and ‘time pressure’ were not chosen as often as those reporting very high, high or moderate stress.
Figure 11: Work-related stressors, by overall stress
Wellbeing in regional and remote schools
Professional wellbeing can be influenced by a variety of both individual and contextual factors, like school size and location. School size can vary by several factors, including sector and geolocation. Schools in regional and remote areas tend to have fewer teachers and fewer enrolled students (AITSL, 2023). Examining Teacher Survey results by geolocation enables a better understanding of how differences in regional contexts may be related to differences in the workforce experiences of teachers, including professional wellbeing and job demands.
Teachers working in regional and remote schools tended to report broadly similar levels of professional wellbeing to their colleagues in major cities, with a few notable differences.
On a scale from 0 (no stress) to 5 (severe stress) there were only slight differences with regards to location in levels of stress, with teachers in major cities recording a mean score of 2.71 and those working in regional and remote areas having scores from 2.66 to 2.68, which corresponds to a moderate amount of stress (Table 3). The same was true of burnout, with teachers in major cities reporting a mean score of 2.89 and those working in regional and remote areas having scores from 2.85 to 2.88 on a scale from 1 (no burnout) to 5 (high burnout). These scores correspond to teachers feeling stressed or having a low level of burnout.
Table 3: Stress and burnout, by remoteness
Wellbeing measure | Major cities (mean) | Inner regional (mean) | Outer regional (mean) | Remote / very remote (mean) |
Stress | 2.71 | 2.66 | 2.66 | 2.68 |
Burnout | 2.89 | 2.88 | 2.87 | 2.85 |
Similarly, there were only marginal differences in teachers’ feelings due to work (Table 4). The biggest difference was in feelings of happiness, with teachers in remote / very remote areas reporting a mean happiness score of 3.54 and teachers in major cities recording a mean score of 3.48, on a scale from 1 (never or very rarely) to 5 (very often or always).
Table 4: Feelings due to work, by remoteness
Feeling about work | Major cities (mean) | Inner regional (mean) | Outer regional (mean) | Remote / very remote (mean) |
Happy | 3.48 | 3.48 | 3.48 | 3.54 |
Enthusiastic | 3.25 | 3.24 | 3.26 | 3.28 |
Worried | 3.43 | 3.47 | 3.46 | 3.45 |
Miserable | 2.87 | 2.87 | 2.90 | 2.87 |
There were some notable differences in the stressors that teachers in regional and remote areas reported experiencing when compared to those living in major cities (Table 5).
Teachers in remote and very remote areas were less likely to report the following issues as stressors than those living in metropolitan areas:
- Administrative duties (35% vs. 47%, -12 percentage point difference)
- Time pressure (33% vs. 45%, -12 percentage points)
- Workload (58% vs. 67%, -9 percentage points)
- Dealing with students, parents and the community (38% vs. 46%, -8 percentage points)
- Competing work and home responsibilities (26% vs. 33%, -7 percentage points)
- Work schedule or hours (13% vs. 20%, -7 percentage points).
However, teachers in remote and very remote areas were more likely to experience different stressors, including:
- Social environment (25% vs. 16%, +9 percentage points)
- Organisational / workplace change (19% vs. 14%, +5 percentage points)
- Physical aggression, violence (13% vs. 8%, +5 percentage points)
- Unclear job expectations (13% vs. 9%, +4 percentage points)
- Incivility, bullying, harassment (10% vs. 6%, +4 percentage points)
- Work doesn’t match specialisation / experience (11% vs. 7%, +4 percentage points).
Table 5: Stressors, by remoteness
Stressor | Major cities | Inner regional | Outer regional | Remote / very remote |
Workload | 67% | 64% | 63% | 58% |
Dealing with students / parents / community | 46% | 47% | 47% | 38% |
Time pressure | 45% | 44% | 42% | 33% |
Administrative duties | 47% | 46% | 42% | 35% |
Emotional load | 34% | 34% | 35% | 35% |
Competing work / home responsibilities | 33% | 31% | 31% | 26% |
Social environment | 16% | 18% | 20% | 25% |
Work schedule or hours | 20% | 16% | 16% | 13% |
Organisational / workplace change | 14% | 14% | 13% | 19% |
Management of work | 14% | 14% | 14% | 17% |
Physical aggression, violence | 8% | 12% | 11% | 13% |
Technology / equipment | 8% | 9% | 9% | 11% |
Unclear job expectations | 9% | 9% | 9% | 13% |
Job security | 8% | 8% | 7% | 8% |
Required / expected to work from school | 11% | 8% | 8% | 9% |
Can choose how work is done | 9% | 8% | 7% | 9% |
Incivility, bullying, harassment | 6% | 8% | 8% | 10% |
Work doesn’t match specialisation / experience | 7% | 7% | 9% | 11% |
Nature of work | 6% | 6% | 8% | 7% |
Physical environment | 5% | 5% | 4% | 7% |
Racism, discrimination | 1% | 1% | 1% | 2% |
Identity-based additional work | 1% | 1% | 1% | 1% |
There were no notable differences in respondents’ career intentions across regional and remote areas and major cities (Figure 13). The proportion of the teacher workforce who reported that they intended to stay in the profession was consistent across all remoteness levels, ranging from 23% to 24%.
The proportion of the teacher workforce who reported intending to leave the profession ranged between 39% and 41% across remoteness areas, with those in remote and very remote areas marginally less likely to report intending to leave relative to those in major cities.
There were also some small differences in the proportion of teachers who reported that they were uncertain about their intentions to remain in the profession, ranging from 34% to 37% across remoteness levels. Those in inner regional and remote / very remote areas were fractionally more likely to report having uncertain intentions (37%) than those in outer regional areas (34%).
Figure 13: Career intentions, by remoteness
Professional wellbeing and career intentions
Career intentions
Around one-quarter (26%) of teachers reported an intention to stay in the profession until retirement, while just over a third (35%) reported being unsure about their future career intentions. Almost two-fifths (39%) reported intending to leave the profession before retirement (Figure 14).
Those who reported intending to leave before retirement were asked about their intended timeframes (within 1 year, 2–4 years, 5–9 years, 10+ years, or ‘unsure when’). Most of these respondents (24%) reported an intention to leave within 5–9 years (10%), within 10+ years (6%) or were unsure when they intended to leave (8%). Those who reported an intention to leave in the longer term, especially more than 10 years into the future, may not have a firm plan to leave and may not end up leaving the teaching profession at all.
In contrast, fewer respondents reported an intention to leave within a shorter timeframe (14%) including those who reported an intention to leave within 1 year (5%) or within 2–4 years (9%). This is notable because previous ATWD reporting has shown that the proportion of teachers who intend to leave the profession in the immediate future – particularly within one year or less – is generally aligned with annual teacher registration discontinuation rates (AITSL, 2024). This suggests that short-term intentions to leave may involve a greater degree of certainty while longer-term timeframes may involve a greater degree of uncertainty.
Figure 14: Career intentions, teacher workforce
Note. Due to rounding, figures do not add to 100%.
Taken together, these results indicate that most teachers (86%) were either:
- Unsure about their overall intentions to remain in the profession (35%)
- Intended to remain in the profession until retirement (26%)
- Intended to leave before retirement but within a longer timeframe (5–9 years, 10+ years; 16%)
- Intended to leave before retirement but were unsure about when (8%).
This suggests there are ample opportunities for retaining most teachers in the profession.
The findings also suggest avenues on which to focus retention strategies. For example, of those teachers who intended to leave the profession, the most prevalent reasons for wanting to leave were:
- Heavy workload (75%)
- To achieve a better work-life balance (69%)
- Finding teaching too stressful or teaching impacting their wellbeing or mental health (68%)
- Administrative workload (63%)
- Insufficient pay (52%)
- Heavy demands of professional regulation (e.g., professional learning, practice etc.; 50%).
These factors align with the stressors and job demands reported above. Addressing them may help to retain teachers whose timeframes to leave the profession are in the longer term, or those teachers who are unsure of their broader intentions.
How teachers’ wellbeing affects their career intentions
How positive and negative feelings affect career intentions
The relationship between positive and negative feelings and teachers’ intentions to leave the profession was examined. This analysis included teachers who reported they intended to leave the profession (over any time period), including those who were unsure of their time period.
As noted above, the proportion of all teachers who reported intending to leave the teaching profession at some stage was 39%. Where teachers reported having both high positive feelings and low negative feelings because of their work, this proportion dropped to 19%. However, where teachers had a combination of low positive feelings and high negative feelings, the proportion increased to 66%, suggesting a clear interaction between teachers’ feelings due to their work and their career intentions.
How stressors affect career intentions
Overall stress and some individual work-related stressors had a statistically significant, but weak relationship to intentions to leave (more information is available in the Technical Appendix). These stressors, listed in order from the strongest to the weakest relationship, included:
- Overall stress
- Ability to choose how work is done
- Additional identity-based work
- Required / expected to work from school
- Emotional load
- Work schedule / hours
- Workload
- Physical aggression / violence
- Administrative duties.
These results indicate a weak relationship between individual stressors and teachers’ intentions to leave their profession before retirement. However, the strongest relationship was between teachers’ overall level of stress and career intentions, meaning that individual stressors likely impact stress, which in turn increases teachers’ intentions to leave their profession.
How burnout, health-related quality of life and stress affect career intentions
In addition to understanding teachers’ career intentions, analysis was undertaken of the impact teachers’ reported wellbeing had on intentions to stay or leave the teaching profession. When teachers experienced higher levels of burnout, poor health-related quality of life and stress, they were more likely to intend to leave the profession before retirement (see the Technical Appendix for more details).
This relationship was strongest for burnout as indicated by the following findings:
- For each one-step increase along the burnout scale (five-point scale from nil to high), teachers were 2.26 times more likely to intend to leave the profession than those who indicated that they had no symptoms of burnout
- For each 1 standard deviation worsening of health-related quality of life, the odds that a teacher intended to leave the profession were 2.20 times higher
- For each additional step along the stress scale (six-point scale from nil to severe), the odds that a teacher intended to leave the profession were 1.56 times higher than those who indicated that they had no stress.
Teacher wellbeing has a direct impact on reported career intentions, particularly in the case of burnout and poor health-related quality of life. Therefore, improvements in professional wellbeing and supports that help prevent teachers from reaching higher levels of burnout may improve the retention of teachers in the profession.
How teachers’ wellbeing drives their intended time to leave the profession
Analysis of the factors that drive shorter-term intentions to leave the profession before retirement indicated that as work-related burnout increased, so did the likelihood of teachers reporting shorter timeframes for intending to leave the profession (see the Technical Appendix for more details).
For each increase in level of burnout, teachers were:
- 2.90 times more likely to intend to leave the profession in 1 year than in 10+ years
- 1.96 times more likely to intend to leave the profession in 2–4 years than in 10+ years
- 1.48 times more likely to intend to leave the profession in 5 years than in 10+ years.
Poor health-related quality of life and stress were not significant predictors of intentions to leave the profession within shorter timeframes.
Conclusion
Safeguarding teachers’ professional wellbeing is crucial. Teachers play a critical role in shaping Australia’s future, and their mental and emotional health directly impacts their ability to deliver quality education to its young people. Ensuring that teachers have the support and resources they need to maintain their professional wellbeing is essential for fostering a positive, effective learning environment and promoting the overall health of the educational community.
This publication presents the responses of teachers to questions about their wellbeing that were included in the 2023 Australian Teacher Workforce Survey. Analysis has been presented on the ways in which sources of work-related stress vary by certain characteristics such as age and position, as well as how different components of teachers’ professional wellbeing, such as stress, burnout and health-related quality of life, are related to reported career intentions.
The analysis presented here showed that job resources can help to improve work-related stress, burnout and negative feelings, while also boosting positive feelings. Job demands can have the opposite effect, increasing work-related stress, burnout and negative feelings, and reducing health-related quality of life.
Most teachers reported that their work made them feel happy and / or enthusiastic. These positive feelings had a protective effect on the relationship between negative feelings (feeling miserable or worried) and increased stress. Even where respondents did report that work made them feel worried or miserable, they were less likely to be stressed if work also made them feel good. Positive feelings due to work were also linked to increased intentions to remain in the teaching profession until retirement, while negative feelings had the opposite association. Finding ways to increase teachers’ positive feelings due to their work appear to be as important as reducing negative feelings. In particular, improving access to job resources for teachers may play an important role in achieving this, as they were associated with increased positive feelings due to work.
The reported work-related stress levels of different teacher groups varied, as did the sources of work-related stress. The findings presented highlight the importance of reducing teachers’ workloads and time pressures by reducing any unnecessary duties and making the social and physical environment of the workplace as safe and positive as possible. While some teachers reported stressors relating to the emotional demands of work, particularly teachers aged under 40, older teachers may need additional support to navigate technology requirements in the classroom and change in the workplace.
Work-related burnout and health-related quality of life were associated with respondents’ intentions to leave the profession. Burnout had the strongest relationship to intentions to leave teaching before retirement and was particularly associated with intentions to leave in the short term, which has the strongest relationship to actual rates of attrition. Targeted initiatives to identify those at risk of burnout may help to retain those teachers most likely to report short-term intentions to leave the profession.
These findings suggest insights for consideration by employers and policymakers:
- A continued focus on increasing access to job resources, such as teachers’ sense of autonomy at work, and a reduction in job demands, like unrealistic time pressures and challenging student behaviour, may help protect professional wellbeing. This might involve reducing administrative burden and producing resources for teachers to better manage student behaviour
- A continued focus on reducing the impact of work-related stressors on teachers or reducing the stressors themselves, such as high workloads and the emotional load of work, which could similarly protect teachers’ professional wellbeing. This could look like reducing teachers’ administrative load and creating resources to help teachers with the emotional demands of the job
- Targeted interventions aimed at reducing work-related stressors for specific groups, as teachers’ reported experiences of stressors varied by age, position and contract type
- Prevention of teacher burnout by reducing prolonged exposure to job demands and work-related stressors, which may safeguard professional wellbeing and increase retention.
These insights aim to help employers, policymakers and individuals maintain the positive professional wellbeing reported by most teachers. The findings presented here might inform existing wellbeing policies and programs as well as those developed in the future. These findings also support the focus of initiatives in the National Teacher Workforce Action Plan to reduce teacher workload, which should contribute to improved teacher wellbeing (Department of Education, 2022). All state and territory education departments, as well as the independent and Catholic sectors, also have a range of policies and programs in place to reduce or better manage teacher workload and support teacher wellbeing (Department of Education, 2022).
It is important to note that this publication focused on the effects of work-related factors on teacher wellbeing only. There are many additional personal, social and cultural impacts on an individual’s wellbeing that may be beyond the control of employers. While individuals are responsible for their own wellbeing, employers also play a crucial role in creating a supportive workplace environment and providing supports and resources to promote overall health and satisfaction for their employees. Understanding the professional wellbeing of teachers is key to developing evidence-informed initiatives aimed at supporting them to thrive and remain in the profession, continuing the valuable work of educating Australia’s young people.
References
AITSL. (2022). Spotlight: Wellbeing in Australian schools. Australian Institute for Teaching and School Leadership. https://www.aitsl.edu.au/research/spotlights/wellbeing-in-australian-schools
AITSL. (2023). Australia’s teacher workforce today. Australian Institute for Teaching and School Leadership (AITSL). https://www.aitsl.edu.au/research/spotlights/australia-s-teacher-workforce-today
AITSL. (2024). National Trends: Teacher Workforce. https://www.aitsl.edu.au/research/australian-teacher-workforce-data/publications-and-data-tools/national-trends-teacher-workforce
Australian Government Department of Education. (2022). Teacher workforce shortages issues paper. https://ministers.education.gov.au/clare/teacher-workforce-shortages-issues-paper
Bakker, A. B., & Demerouti, E. (2007). The job demands‐resources model: State of the art. Journal of Managerial Psychology, 22(3), 309–328. https://doi.org/10.1108/02683940710733115
Bakker, A. B., & Demerouti, E. (2017). Job demands-resources theory: Taking stock and looking forward. Journal of Occupational Health Psychology, 22(3), 273–285. https://doi.org/10.1037/ocp0000056
Billett, P., Turner, K., & Li, X. (2023). Australian teacher stress, well-being, self-efficacy, and safety during the COVID-19 pandemic. Psychology in the Schools, 60(5), 1394–1414. https://doi.org/10.1002/pits.22713
Carroll, A., Forrest, K., Sanders-O’Connor, E., Flynn, L., Bower, J. M., Fynes-Clinton, S., York, A., & Ziaei, M. (2022). Teacher stress and burnout in Australia: Examining the role of intrapersonal and environmental factors. Social Psychology of Education, 25(2–3), 441–469. https://doi.org/10.1007/s11218-022-09686-7
Collie, R. J. (2023). Teacher well-being and turnover intentions: Investigating the roles of job resources and job demands. British Journal of Educational Psychology, 93(3), 712–726. https://doi.org/10.1111/bjep.12587
Dabrowski, A. (2020). Teacher wellbeing during a pandemic: Surviving or thriving? Social Education Research, 2(1), 35–40. https://doi.org/10.37256/ser.212021588
Department of Education. (2022). National Teacher Workforce Action Plan [Text]. https://www.education.gov.au/teaching-and-school-leadership/resources/national-teacher-workforce-action-plan
Doan, S., Steiner, E. D., & Pandey, R. (2024). Teacher Well-Being and Intentions to Leave in 2024: Findings from the 2024 State of the American Teacher Survey. RAND Corporation. https://www.rand.org/content/dam/rand/pubs/research_reports/RRA1100/RRA1108-12/RAND_RRA1108-12.pdf
Hazra, A. (2017). Using the confidence interval confidently. Journal of Thoracic Disease, 9, 4124–4129. https://doi.org/10.21037/jtd.2017.09.14
Heffernan, A., Longmuir, F., Bright, D., & Kim, M. (2019). Perceptions of teachers and teaching in Australia (pp. 1–21). Monash University. https://researchmgt.monash.edu/ws/portalfiles/portal/302824782/301566106_oa.pdf
Henseler, J., Ringle, C. M., & Sarstedt, M. (2015). A new criterion for assessing discriminant validity in variance-based structural equation modeling. Journal of the Academy of Marketing Science, 43(1), 115–135. https://doi.org/10.1007/s11747-014-0403-8
Iancu, A. E., Rusu, A., Măroiu, C., Păcurar, R., & Maricuțoiu, L. P. (2018). The effectiveness of interventions aimed at reducing teacher burnout: A meta-analysis. Educational Psychology Review, 30(2), 373–396. https://doi.org/10.1007/s10648-017-9420-8
Lesener, T., Gusy, B., & Wolter, C. (2019). The job demands-resources model: A meta-analytic review of longitudinal studies. Work & Stress, 33(1), 76–103. https://doi.org/10.1080/02678373.2018.1529065
Lipscombe, K., Tindall-Ford, S., & Lamanna, J. (2023). School middle leadership: A systematic review. Educational Management Administration & Leadership, 51(2), 270–288. https://doi.org/10.1177/1741143220983328
Litchfield, P. (2021). Workplace wellbeing. Perspectives in Public Health, 141(1), 11–12. https://doi.org/10.1177/1757913920951388
Madigan, D. J., & Kim, L. E. (2021). Towards an understanding of teacher attrition: A meta-analysis of burnout, job satisfaction, and teachers’ intentions to quit. Teaching and Teacher Education, 105, 103425. https://doi.org/10.1016/j.tate.2021.103425
Mahfouz, J. (2020). Principals and Stress: Few Coping Strategies for Abundant Stressors. Educational Management Administration & Leadership, 48(3), 440–458. ERIC.
National Education Union. (2023, April 5). State of education 2023: Recruitment and retention. https://neu.org.uk/latest/press-releases/state-education-2023-recruitment-and-retention
Räsänen, K., Pietarinen, J., Pyhältö, K., Soini, T., & Väisänen, P. (2020). Why leave the teaching profession? A longitudinal approach to the prevalence and persistence of teacher turnover intentions. Social Psychology of Education, 23(4), 837–859. https://doi.org/10.1007/s11218-020-09567-x
Saloviita, T., & Pakarinen, E. (2021). Teacher burnout explained: Teacher-, student-, and organisation-level variables. Teaching and Teacher Education, 97, 103221. https://doi.org/10.1016/j.tate.2020.103221
Shah, C., Richardson, P., & Watt, H. (2020). Teaching ‘out of field’ in STEM subjects in Australia: Evidence from PISA 2015. GLO discussion paper. https://www.econstor.eu/handle/10419/215639
Skaalvik, E., & Skaalvik, S. (2018). Job demands and job resources as predictors of teacher motivation and well-being. Social Psychology of Education, 21. https://doi.org/10.1007/s11218-018-9464-8
Taherdoost, H., Sahibuddin, S., & Jalaliyoon, N. (2022). Exploratory factor analysis; concepts and theory. Advances in Applied and Pure Mathematics, 27, 375–382.
Teasdale, E. L. (2006). Workplace stress. Psychiatry, 5(7), 251–254. https://doi.org/10.1053/j.mppsy.2006.04.006
Thorpe, K., Jansen, E., Sullivan, V., Irvine, S., McDonald, P., Thorpe, K., Irvine, S., McDonald, P., Lunn, J., Sumsion, J., Ferguson, A., Lincoln, M., Liley, K., Spall, P., & The Early Years Workforce Study team. (2020). Identifying predictors of retention and professional wellbeing of the early childhood education workforce in a time of change. Journal of Educational Change, 21(4), 623–647. https://doi.org/10.1007/s10833-020-09382-3
Turner, K., & Theilking, M. (2021). Teacher wellbeing: Its effects on teaching practice and student learning. Issues in Educational Research, 29(3), 938–960. https://search.informit.org/doi/10.3316/ielapa.641930197632835
Viac, C., & Fraser, P. (2020). Teachers’ well-being: A framework for data collection and analysis (OECD Education Working Papers 213). https://doi.org/10.1787/c36fc9d3-en
Wang, H., & Hall, N. C. (2021). Exploring relations between teacher emotions, coping strategies, and intentions to quit: A longitudinal analysis. Journal of School Psychology, 86, 64–77. https://doi.org/10.1016/j.jsp.2021.03.005
Ware, J. E., & Sherbourne, C. D. (1992). The MOS 36-item short-form health survey (SF-36). I. Conceptual framework and item selection. Medical Care, 30(6), 473–483.
Technical Appendix
Teacher Survey wellbeing questions analysed in this publication
Questions in the main survey
Positive and negative feelings
1. Thinking about the past three months in your current organisation, how often has your work made you feel...
| | Never or very rarely | Rarely | Sometimes | Often | Very often or always |
Worried | ( ) | ( ) | ( ) | ( ) | ( ) |
Miserable | ( ) | ( ) | ( ) | ( ) | ( ) |
Happy | ( ) | ( ) | ( ) | ( ) | ( ) |
Enthusiastic | ( ) | ( ) | ( ) | ( ) | ( ) |
Stress
2. How would you rate your current level of work-related stress?
- Nil - not experiencing any work-related stress
- Low or mild
- Moderate
- High
- Very high
- Severe
Stressors
3. What are the main causes of your work-related stress? (Select up to five options)
- Workload
- Time pressure
- Content, variety, or difficulty of work
- Additional work given to me because of my identity (e.g., race, gender, sexuality, etc.)
- Work that doesn't match my specialisation or experience
- Ability to choose how my work is done
- Dealing with students, parents, and the wider school community
- Unclear job expectations
- Management of work (e.g., supervision, training, information, support)
- Physical environment
- Emotional load
- Social environment (e.g., relationships with colleagues, manager or senior leaders)
- Incivility, bullying, harassment
- Physical aggression, violence
- Racism, discrimination
- Work schedule or hours
- Competing home and work responsibilities (including caring responsibilities)
- Organisation or workplace change
- Job security
- Requirements or expectations that I work from school
- Administrative duties
- Technology or equipment
- Other (please specify): _________________________________________________
Burnout
4. Overall, based on your definition of burnout, how would you rate your level of burnout?
- I enjoy my work. I have no symptoms of burnout
- Occasionally I am under stress, and I don’t always have as much energy as I once did, but I don’t feel burned out
- I am definitely burning out and have one or more symptoms of burnout, such as physical and emotional exhaustion
- The symptoms of burnout that I am experiencing won’t go away. I think about frustration at work a lot.
- I feel completely burned out and often wonder if I can go on. I am at the point where I may need some changes or may need to seek some sort of help
Questions in the optional wellbeing module
Health-related quality of life
5. During the past four weeks, have you had any of the following problems with your work or other regular daily activities as a result of any emotional problems (such as feeling depressed or anxious)?
| | Yes | No |
Cut down the amount of time you spent on work or other activities. | ( ) | ( ) |
Accomplished less than you would like. | ( ) | ( ) |
Didn't do work or other activities as carefully as usual. | ( ) | ( ) |
6. During the past four weeks, to what extent has your physical health or emotional problems interfered with your normal social activities with family, friends, neighbours, or groups?
- Not at all
- Slightly
- Moderately
- Quite a bit
- Extremely
7. These questions are about how you feel and how things have been with you during the past four weeks. For each question, please give the one answer that comes closest to the way you have been feeling.
How much of the time during the past four weeks...
| | All of the time | Most of the time | A good bit of the time | Some of the time | A little of the time | None of the time |
Did you feel full of pep? | ( ) | ( ) | ( ) | ( ) | ( ) | ( ) |
Have you been a nervous person? | ( ) | ( ) | ( ) | ( ) | ( ) | ( ) |
Have you felt so down in the dumps that nothing could cheer your up? | ( ) | ( ) | ( ) | ( ) | ( ) | ( ) |
Have you felt calm and peaceful? | ( ) | ( ) | ( ) | ( ) | ( ) | ( ) |
Did you have a lot of energy? | ( ) | ( ) | ( ) | ( ) | ( ) | ( ) |
Have you felt downhearted and blue? | ( ) | ( ) | ( ) | ( ) | ( ) | ( ) |
Did you feel worn out? | ( ) | ( ) | ( ) | ( ) | ( ) | ( ) |
Have you been a happy person? | ( ) | ( ) | ( ) | ( ) | ( ) | ( ) |
Did you feel tired? | ( ) | ( ) | ( ) | ( ) | ( ) | ( ) |
8. During the past four weeks, how much of the time has your physical health or emotional problems interfered with your social activities (like visiting with friends, relatives, etc.)?
- All of the time
- Most of the time
- Some of the time
- A little of the time
- None of the time
Job demands and resources
9. To what extent do you agree with the following statements?
| | Strongly disagree | Disagree | Neither agree nor disagree | Agree | Strongly agree |
My work is emotionally demanding | ( ) | ( ) | ( ) | ( ) | ( ) |
I get emotionally involved in my work | ( ) | ( ) | ( ) | ( ) | ( ) |
I am clear what is expected of me at work | ( ) | ( ) | ( ) | ( ) | ( ) |
I know how to go about getting my job done | ( ) | ( ) | ( ) | ( ) | ( ) |
Different teams at work demand things from me that are difficult to do at the same time | ( ) | ( ) | ( ) | ( ) | ( ) |
I receive incompatible requests from two or more people | ( ) | ( ) | ( ) | ( ) | ( ) |
Are personality conflicts evident in your work team? | ( ) | ( ) | ( ) | ( ) | ( ) |
Is there tension among members in your work team? | ( ) | ( ) | ( ) | ( ) | ( ) |
Do you and members of your work team disagree about the work being done? | ( ) | ( ) | ( ) | ( ) | ( ) |
Are there differences of opinion between you and members of your work team over task priorities? | ( ) | ( ) | ( ) | ( ) | ( ) |
I have unrealistic time pressures | ( ) | ( ) | ( ) | ( ) | ( ) |
I have to neglect some tasks because I have too much to do | ( ) | ( ) | ( ) | ( ) | ( ) |
Managing students’ behaviour takes a lot of time and effort | ( ) | ( ) | ( ) | ( ) | ( ) |
Many of my students show little effort at schoolwork | ( ) | ( ) | ( ) | ( ) | ( ) |
I have more diverse needs in my class than I, as a one teacher, can single handedly support | ( ) | ( ) | ( ) | ( ) | ( ) |
My students do not have access to support services that would benefit their education | ( ) | ( ) | ( ) | ( ) | ( ) |
I have a choice in deciding what I do at work | ( ) | ( ) | ( ) | ( ) | ( ) |
I have some say over the way I get the job done | ( ) | ( ) | ( ) | ( ) | ( ) |
I get the help and support I need from my supervisor | ( ) | ( ) | ( ) | ( ) | ( ) |
My supervisor is willing to listen to my work-related problems | ( ) | ( ) | ( ) | ( ) | ( ) |
If the work gets difficult, my co-workers will help me | ( ) | ( ) | ( ) | ( ) | ( ) |
I get the help and support I need from my co-workers | ( ) | ( ) | ( ) | ( ) | ( ) |
I feel that my supervisor values my contributions to this {school [Q3a] / early learning centre / pre-school [Q3b]} | ( ) | ( ) | ( ) | ( ) | ( ) |
My supervisor gives me sufficient credit for my hard work | ( ) | ( ) | ( ) | ( ) | ( ) |
These processes are free from bias in my work team | ( ) | ( ) | ( ) | ( ) | ( ) |
Employees in my work team can express their views and feelings during those processes | ( ) | ( ) | ( ) | ( ) | ( ) |
I am consulted about proposed changes at work | ( ) | ( ) | ( ) | ( ) | ( ) |
I am clearly informed about the nature of the changes that take place in this workplace | ( ) | ( ) | ( ) | ( ) | ( ) |
The teachers and the {school [Q3a] / early learning centre / pre-school [Q3b]}administration have a common understanding of the direction in which the {school [Q3a] / early learning centre / pre-school [Q3b]} should be developed | ( ) | ( ) | ( ) | ( ) | ( ) |
The teachers at this {school [Q3a] / early learning centre / pre-school [Q3b]}practice a common set of norms and rules | ( ) | ( ) | ( ) | ( ) | ( ) |
My colleagues and I have the same opinion about what is important in education | ( ) | ( ) | ( ) | ( ) | ( ) |
I feel that this {school [Q3a] / early learning centre / pre-school [Q3b]} shares my view of what constitutes good teaching | ( ) | ( ) | ( ) | ( ) | ( ) |
Career intentions
10. Do you think you will permanently stop working as a teacher, leader or early educator before you retire?
- Yes
- No
- Unsure
11. How many more years can you see yourself working in the teaching profession?
- I have already stopped working in the profession
- Unsure
- 1 year
- 2 years
- …
- 50 years
12. What are your reasons for considering leaving teaching?
Select as many as apply
- I never intended teaching to be a long-term career
- I have found that I am not suited to working in schools / early childhood settings
- I am not enjoying working in schools / early childhood settings
- Family reasons
- Unsatisfactory relationships with other staff
- To seek employment elsewhere in education, but not directly in schools / early childhood settings
- To seek employment outside of education
- The workload is too heavy
- Insufficient support staff
- Class sizes are too large
- I'm facing challenges with student behaviour management
- Insufficient professional recognition of teaching skills and knowledge by wider school management
- The poor public image of the profession
- Changes imposed on schools / early childhood settings from outside (e.g. by government)
- Dissatisfaction with performance appraisal processes
- The demands of professional regulation (e.g. professional learning, practice, etc.) are too heavy
- I am finding it too stressful / it is impacting my well being or mental health
- To achieve a better work / life balance
- Insufficient pay
- Retirement
- Other - (Textbox required if selected): ___________________________________________ *
- Other - (Textbox required if selected): ___________________________________________ *
- School culture / environment
- Red tape and administrative work load
- Challenges with the behaviour of parents
Statistical analysis
Wellbeing module analysis
In addition to the wellbeing questions included in the main Teacher Survey, an optional wellbeing module was included to obtain a broader range of data. Analysis of these questions considered the likelihood that those who opted to participate may have been experiencing lower levels of wellbeing than those who chose not to complete the module. This likelihood was determined through the calculation of inverse probability weights (IPWs), which were applied to calculations. The IPWs were calculated using the predicted probabilities from a logistic regression of overall workplace stress on commencement of the opt-in wellbeing module. For statistical modelling conducted using STATA, these were included as probability weights. The exception to this was that for some follow-up post-estimation tests (including cross-model comparisons), a second version of the model was run with the IPWs as analytic weights. Although analytic weights in STATA are not necessarily incorporated consistently across different types of analyses, some post-estimate tests cannot be conducted when using probability weights. This approach is suitable because there were only negligible differences between the same analyses run using IPWs as analytic weights rather than probability weights. However, it does mean that there could be negligible discrepancies in the size of the differences calculated by looking at output tables compared to the size of difference that post-estimation tests were calculated on. These negligible discrepancies did not change any conclusions.
Exploratory factor analysis of job demands-resources and health-related quality of life
Factor analysis and measurement considerations
Exploratory factor analysis (EFA)[13] was conducted to identify underlying patterns or structures in the job demands items, the job resources items, and the subscales of the health-related quality of life measure. Factor loadings are the coefficients that represent the relationship between each variable and the underlying groups, or factors, identified by the EFA. These factor loadings were then used to calculate the respondents’ standardised score on the factor.
Job demands and resources
The job demands items loaded onto two factors (refer to Table 6), whereas all the job resource items loaded onto the same factor.
As shown in Table 6, job demands items that relate to issues with colleagues loaded more strongly[14] with the first job demands factor. For example:
- Tension among members in work team
- Incompatible requests from two or more people
- Differences of opinion between members of work team over task priorities.
Although the EFA indicated the presence of two factors, many items loaded similarly onto both factors (sometimes referred to as ‘cross-loading’). Three items loaded on both factors: ‘my work is emotionally demanding’, ‘managing students’ behaviour takes a lot of time and effort’, and ‘I have more diverse needs in my class than I, as one teacher, can single-handedly support’. These can be seen as the core of job demands, shared across the factors.
Two items had loadings below 0.30 on both factors – ‘I get emotionally involved in my work’ and ‘many of my students show little effort at schoolwork’ – suggesting that while these may be challenges encountered at work, they are not necessarily creating strong job demands. Notably, in both cases, the other item in the pair did load onto a factor.
The item ‘I get emotionally involved in my work’ was in an item-pair with ‘work is emotionally demanding.’ For respondents working as teachers in schools, these items were moderately correlated (r=.294). However, only the item relating to emotional demands and not the item involving emotional involvement loaded onto the job demands factors.
The item ‘many of my students show little effort at schoolwork’ was in an item-pair with ‘managing students’ behaviour takes a lot of time and effort’. These items were moderately correlated for respondents who were teachers working in schools (r=.341).
However, while both items are concerned with student behaviour, only the item referencing teacher effort loaded onto a job demands factor. Together, the patterns of loading and non-loading for these item pairs highlight that challenges associated with work are not necessarily job demands – only challenges that required effort by respondents clustered with job demands.[15]
The two job demands factors were interpreted based on the patterns of absolute loadings and the difference in loading sizes across the factors. The effort required by teachers characterised both factors. The job demands factors were described as follows: job demands factor 1 (JD1) is about effort which occurs from issues with colleagues, workload and role clarity, and challenges of student resourcing, whereas job demands factor 2 (JD2) is about effort in the absence of team conflict. To parsimoniously capture the concepts underpinning job demands, which were largely independent of one another (r=0.04), the two factors were modelled together in all analyses.
As per the key below, factor loadings less than -0.45 are dark orange, between -0.3 and -0.44 are light orange, between -0.29 and 0.29 are white, between 0.3 to 0.44 are light green, and greater than 0.45 are dark green.
≤0.45 | |
-0.3 to -0.44 | |
-0.29 to 0.29 | |
0.3 to 0.44 | |
≥0.45 | |
Table 6: Exploratory factor analysis output, factor loadings for job demands items
Items | Job demands factor 1 (JD1) | Job demands factor 2 (JD2) |
My work is emotionally demanding | 0.47 | 0.36 |
I get emotionally involved in my work | 0.17 | 0.16 |
Different teams at work demand things from me that are difficult to do at the same time | 0.58 | 0.07 |
I receive incompatible requests from two or more people | 0.59 | -0.05 |
Are personality conflicts evident in your work team? | 0.58 | -0.49 |
Is there tension among members in your work team? | 0.62 | -0.49 |
Do you and members of your work team disagree about the work being done? | 0.53 | -0.35 |
Are there differences of opinion between you and members of your work team over task priorities? | 0.58 | -0.33 |
I have unrealistic time pressures | 0.55 | 0.26 |
I have to neglect some tasks because I have too much to do | 0.52 | 0.33 |
Managing students’ behaviour takes a lot of time and effort | 0.34 | 0.37 |
Many of my students show little effort at schoolwork | 0.28 | 0.22 |
I have more diverse needs in my class than I, as a one teacher, can single-handedly support | 0.43 | 0.4 |
My students do not have access to support services that would benefit their education | 0.38 | 0.2 |
All of the job resources items were positively correlated and returned a single factor. The highest loading item was ‘I feel that my supervisor values my contributions to this school / early learning centre / pre-school’ (0.778). The only item that did not exceed a loading of 0.30, indicating that it did not technically load on the factor but was correlated with it, was ‘I know how to go about getting my job done’ (0.219). A low loading, in this context, does not mean that this is not a job resource, only that it might be somewhat more independent.
JD1 was strongly negatively related to job resources (r=-.53). However, JD2 was weakly positively related to job resources (r=.18). This is not surprising, given the absence of job demands (e.g., team conflict), can be a good thing, just like the presence of job resources (e.g., supportive colleagues).
Health-related quality of life
Scores for each of the 4 mental health-related subscales of the health-related quality of life measure – mental health, vitality, emotional functioning and social functioning – were calculated. An exploratory factor analysis was performed to determine the underlying structure of the subscales within the measure. This method was selected, rather than taking the average of the four subscales, so that there was no assumption about the relative importance of the dimensions. All subscales loaded onto the same factor (health-related quality of life). Vitality (0.828), mental health (0.846) and social functioning (0.817) all loaded very strongly onto this factor, while emotional functioning loaded strongly (0.630).
Multiple regression between job demands-resources and wellbeing
Unweighted correlations between the 3 job demands and resources factors, and wellbeing measures are presented in Table 7.[16]
Table 7: Unweighted correlation matrix, wellbeing measures and job demands / resources factors, 2023
| JD1 | JD2 | Job resources factor |
Positive feelings | -.39 | -.10 | .51 |
Negative feelings | .54 | .15 | -.48 |
Burnout | .50 | .20 | .-.41 |
Poor health-related quality of life | .54 | .20 | -.42 |
Overall work-related stress | .49 | .21 | -.35 |
Job resources do not occur in isolation from job demands, and the 2 job demands factors can occur together. To account for these simultaneous relationships, and to correct for any self-selection bias into the opt-in module, regression analyses were used.[17]
Table 8 provides the regression results for all the relationships between job demands and resources factor scores (standardised) and the five wellbeing measures, which were examined in separate models.
The R2 values for these models ranged from .30 (stress by job demand-resources factors) to .38 (negative feelings by job demand-resources factors). This indicates that 30–38% of the variation in wellbeing measures were explained by the job demands-resources factors. This analysis provides two insights. First, that a teacher’s experiences of job demands and resources has notable relationships with wellbeing, accounting for 30–38% of the variance in their wellbeing. Second, that other, unmeasured job demands and resources or other personal characteristics that were not included here, also contribute to the wellbeing of Teacher Survey respondents.
Table 8: Multiple linear regression output for job demands and resources factors and wellbeing measures
| | | Predictors |
Model outcome | R2 value | JD1 | JD2 | Job resources factor |
Coefficient | Robust SE | Coefficient | Robust SE | Coefficient | Robust SE |
Positive feelings | .306 | -0.113 | 0.006 | -0.123 | 0.005 | 0.388 | 0.007 |
Negative feelings | .379 | 0.349 | 0.007 | 0.017 | 0.005 | -0.329 | 0.007 |
Poor health-related quality of life | .374 | -0.394 | 0.007 | -0.208 | 0.006 | 0.248 | 0.008 |
Overall work-related stress | .301 | 0.044 | 0.008 | 0.241 | 0.007 | -0.218 | 0.010 |
Burnout | .335 | 0.340 | 0.007 | 0.214 | 0.006 | -0.274 | 0.008 |
Logistic regression analysis of the relationship between workplace stressors and career intentions
Table 9: Logistic regression output for workplace stressors, by relationship with intentions to leave the profession
| | Odds ratio | P-value | Robust SE | Lower CI (95%) | Upper CI (95%) |
Overall stress | 1.47 | <.001 | 0.02 | 1.43 | 1.51 |
Ability to choose how work is done | 1.45 | <.001 | 0.08 | 1.30 | 1.60 |
Additional identity-based work | 1.37 | .010 | 0.17 | 1.08 | 1.75 |
Required/expected to work from school | 1.30 | <.001 | 0.07 | 1.18 | 1.44 |
Emotional load | 1.29 | <.001 | 0.04 | 1.21 | 1.37 |
Work schedule/hours | 1.25 | <.001 | 0.05 | 1.16 | 1.36 |
Workload | 1.20 | <.001 | 0.04 | 1.12 | 1.28 |
Racism/discrimination | 1.16 | .195 | 0.14 | 0.93 | 1.46 |
Physical aggression/violence | 1.14 | .005 | 0.05 | 1.04 | 1.25 |
Not working in specialisation | 1.09 | .125 | 0.06 | 0.98 | 1.21 |
Administrative duties | 1.08 | .012 | 0.03 | 1.02 | 1.15 |
Unclear job expectations | 1.08 | .135 | 0.06 | 0.98 | 1.19 |
Incivility, bullying and harassment | 1.06 | .268 | 0.06 | 0.96 | 1.18 |
Management of work | 1.03 | .565 | 0.04 | 0.94 | 1.12 |
Physical environment | 1.00 | .995 | 0.07 | 0.88 | 1.14 |
Dealing with students/parents/community | 0.92 | .014 | 0.03 | 0.87 | 0.98 |
Job security | 0.91 | .074 | 0.05 | 0.81 | 1.01 |
Competing work/home responsibilities | 0.84 | <.001 | 0.03 | 0.79 | 0.90 |
Nature of work | 0.79 | <.001 | 0.05 | 0.69 | 0.90 |
Social environment | 0.79 | <.001 | 0.03 | 0.73 | 0.85 |
Technology and equipment | 0.75 | <.001 | 0.04 | 0.67 | 0.84 |
Time pressure | 0.74 | <.001 | 0.02 | 0.70 | 0.79 |
Organisation/workplace change | 0.73 | <.001 | 0.03 | 0.67 | 0.80 |
Logistic regression of the relationship between professional stress, burnout and health-related quality of life
Logistic regression was conducted to estimate the effect of the three wellbeing measures (work-related stress, burnout, low / poor health-related quality of life) on overall intentions to leave the profession (that is, whether respondents intended to leave the profession or not).
These relationships were first examined separately (that is, via univariate analysis, not accounting for the co-occurrence of the wellbeing measures), among those who completed the opt-in wellbeing module. These results are reported in the main body of the report. Additional analysis of the measures in a multivariate model was carried out and the results are presented in Table 10.
Table 10: Logistic regression output for wellbeing measures, by relationship with intentions to leave the profession
| | Odds ratio | Z-score | P-value | Robust SE | Lower CI (95%) | Upper CI (95%) |
Burnout | 1.89 | 27.33 | <0.001 | 0.044 | 1.81 | 1.98 |
Poor health-related quality of life | 1.51 | 17.79 | <0.001 | 0.035 | 1.45 | 1.58 |
Stress | 0.88 | -6.82 | <0.001 | 0.016 | 0.85 | 0.91 |
Supplementary analyses were performed which controlled for demographic and employment characteristics.[18] After accounting for these characteristics of the respondents there were no changes in the relationship between the wellbeing measures (burnout, health-related quality of life and stress, respectively) and career intentions (ORs=1.91, 1.51, and 0.87).
Multinomial logistic regression of the relationship between wellbeing measures and timing of intentions to leave the profession
Multinomial logistic regression was used to examine whether wellbeing measures such as work-related stress, health-related quality of life and burnout are associated with a greater likelihood of reporting an intention to leave within shorter timeframes (1 year, 2–4 years, 5 years), relative to longer timeframes (10+ years; Table 11). This analysis was limited to only those who reported an intention to leave before retirement.
Table 11: Multinomial logistic regression output for wellbeing measures, by relationship with timing of intentions to leave the profession
Timeframe | Wellbeing measure | RRR | Z-score | P-value | Robust SE | Lower CI (95%) | Upper CI (95%) |
1 year (vs. 10+ years) |
| Burnout | 2.90 | 15.09 | <0.001 | 0.204 | 2.52 | 3.32 |
| Stress | 1.04 | 0.73 | 0.463 | 0.059 | 0.93 | 1.16 |
| Poor health-related quality of life | 1.01 | 0.12 | 0.908 | 0.077 | 0.87 | 1.17 |
2–4 years (vs. 10+ years) |
| Burnout | 1.96 | 11.01 | <0.001 | 0.120 | 1.74 | 2.21 |
| Stress | 1.01 | 0.21 | 0.832 | 0.049 | 0.92 | 1.11 |
| Poor health-related quality of life | 0.95 | -0.84 | 0.403 | 0.060 | 0.84 | 1.07 |
5 years (vs. 10+ years) |
| Burnout | 1.48 | 6.53 | <0.001 | 0.088 | 1.31 | 1.66 |
| Stress | 1.01 | 0.23 | 0.818 | 0.049 | 0.92 | 1.11 |
| Poor health-related quality of life | 0.95 | -0.84 | 0.401 | 0.059 | 0.84 | 1.07 |